Exploration and Exploitation of Petroleum Resources in West Africa
Welcome to the online reading edition of Exploration and Exploitation of Petroleum Resources in West Africa. This mdBook version converts the edited Word manuscript into a structured, searchable resource for students, researchers, policy makers, and energy-sector professionals.
Reading Guide
The book examines the petroleum value chain, upstream oil operations, fiscal regimes, governance risks, and country-level petroleum-sector analysis across West Africa.
Start with the Foreword, move through the General Introduction, or go directly to Chapter 1.
Source Note
This edition was generated from the edited Word manuscript and normalized for web reading with mdBook. Figures extracted from the manuscript are stored in src/images/ and referenced from chapter files using relative paths.
Front Matter
Preface
CONTENTS
FOREWORD
GENERAL INTRODUCTION
PART I: GENERAL INFORMATION ON THE OIL INDUSTRY AND THE CHALLENGES OF RESEARCH AND EXPLOITATION IN WEST AFRICA
Hydrocarbon sector value chain
Different phases of upstream oil and the roles of states
PART TWO: OIL CONTRACTS AND OIL TAXATION IN WEST AFRICA
Tax regimes in the oil sector
- Comparative study of tax regimes in selected West African countries
PART THREE: POLITICAL STABILITY, GOVERNANCE AND CORRUPTION IN THE OIL SECTOR
Key socio-political determinants of oil sector performance
West Africa – in-depth country analysis
GENERAL CONCLUSION
GLOSSARY
BIBLIOGRAPHICAL REFERENCES
List of Figures
Figure 1: Petroleum sector value chain 16
Figure 2: a and b Map showing the MSGBC Basin and Map showing the basins of the northern part of the Gulf of Guinea in West Africa 20
Figure 3: Map showing the sedimentary basins of Mali and Niger 20
Figure 4: Synthetic diagram showing the different oil cuts 30
Figure 5: Different phases of upstream oil 32
Figure 6: Process for allocating oil blocks to the IPC for petroleum exploration and exploitation 35
Figure 7: Gravimetric acquisition (a) showing anomalies in the Coastal Sedimentary Basin of Benin (CGG 2013) and aeromagnetic (b) to characterize the basement and sedimentary formations 37
Figure 8: 3D acquisition principle (a) and seismic cube (b) 38
Figure 9: Seismic amplitude anomalies showing Brightspots and Flatspots 38
Figure 10: Electromagnetism coupled with seismic reflection showing the resistivity contrast at the traps highlighted by seismic 39
Figure 11: Geological section showing the stratigraphic extent of the fictitious Deer-Boar oil system at the critical time (250 Ma). The thermally immature source rock is above the oil window. The active source rock is down-dip of the oil window (Magoon and Dow 1994) 40
Figure 12: Geoseismic section showing petroleum systems in the Benin Coastal Sedimentary Basin, Kerr McGee, 2003 41
Figure 13: Seismic interpretation showing a structural trap (anticline) 42
Figure 14: Some types of traps 42
Figure 15: Depth map showing the roof of a tank 43
Figure 16: Photos showing the core library of Côte d’Ivoire at the Directorate of the PETROCI Analysis and Research Center 47
Figure 17: Methodology Tank Evaluation 50
Figure 18: Diagram showing a reservoir model (Vilgeir Dalen, StatoilHydro, 2007) 51
Figure 19: Oil field production profile showing the life cycle of an oil field 55
Figure 20: Cash flows during the different phases of upstream oil activities (Dr. Alfred Kjemperud, 2007) 62
Figure 21: Economic Value of Hydrocarbon Resources 65
Figure 22: Distribution of income from production (After Johnson, 1995) 66
Figure 23: Classification of tax systems 67
Figure 24: Graph showing the cost stops applied in selected West African countries 75
Figure 25: Simplified organizational chart showing the share of the State and the Contractor in the taxation associated with the CPP of Benin 85
Figure 26: Simplified Organizational Chart Showing the State and Contractor’s Share of the Taxation Used in Ghana’s Model Contract 86
Figure 27: Simplified organizational chart showing the share of the State and the contractor resulting from the taxation associated with the CPP of Côte d’Ivoire 87
Figure 28: Simplified organizational chart showing the share of the State and the Contractor in the taxation associated with the CPP of Nigeria 88
Figure 29: Simplified organizational chart showing the share of the State and the Contractor resulting from the taxation associated with the Senegalese CPP 89
Figure 30: Simplified diagram showing the share of the State and the Contractor resulting from the taxation associated with the CPP of Niger 90
Figure 31: Graph showing the share of net profit accruing to the CPI and the States according to the tax regime applicable in these States 92
Figure 32: Graph showing the distribution of the cash flow between the government and the contractor considering 100 barrels of oil extracted 92
List of Tables
Table 1: Estimation of hydrocarbon resources in West Africa 17
Table 2: Daily output of countries (Trading Economics, 2025) 18
Table 3: Type of crude oil in selected West African countries 21
Table 4: Calculation of financial losses resulting from a measurement error of 0.4 % 58
Table 5: Summary of ad valorem royalty rates applied in selected West African countries 73
Table 6: Oil-profit sharing mechanisms in selected West African countries 78
Table 7: Profit tax rates applied in selected West African countries in the oil sector 80
Table 8: State participation rates in selected West African countries 81
Table 9: Summary of the key tax terms for determining the share of the parties’ overall cash flows for oil 83
Table 10: Distribution of the net revenues (share) of the State and the Contractor arising from the tax regimes of the petroleum laws and regulations of the countries studied 91
Table 11: Cash flow representing the share of each part per 100 barrels of oil produced 91
Abbreviations, Acronyms and Abbreviations
ABEX : Abandon Expenditures
AFREC: African Energy Commission
IEA: International Energy Agency
APPO: Organization of African Petroleum Producers
AVO : Amplitude Variation with Offset
API : American Petroleum Institute
BBL/D/1K: One Thousand Barrels Per Day
BCF: Billion cubic feet
CAPEX : Capital Expenditures
ECOWAS: Economic Community of West African States
CO2: Carbon Dioxide
CPI: International Oil Company
CPP: Production Sharing Contract
CNPC: China National Petroleum Corporation
UNCTAD: United Nations Conference on Trade and Development
DHI: Direct Hydrocarbons Indicator
DPB : Benin Oil Depot Company
DW: Deep Water
IMF: International Monetary Fund
GAO: West Africa Gas Pipeline
LNG: Liquefied Natural Gas
GNPC : Ghanean National Petroleum Company
LPG: Liquefied Petroleum Gas
EITI: Extractive Industries Transparency Initiative
MMBBLS: Million de barils
NNPC: Nigerian National Petroleum Company
NOx: x Nitrogen oxide
OPEX: Operating Expenditures
NATO : North Atlantic Treaty Organization
PDO: Development and Operation Plan
PETROCI: National Company of Petroleum Operations of Côte d’Ivoire
PETROSEN: Société Nationale des Pétroles du Sénégal
GDP: Gross Domestic Product
PPS: Sèmè Oil Project
PSA : Production Sharing Contract
SAPETRO: South Atlantic Petroleum
SAR: Société Africaine de Raffinage
SIR: Société Ivoirienne de Raffinage
SMB: Multinational Bitumen Company
SONANGOL : Société Nationale des Pétroles de l’Angola
SONATRACH: National Hydrocarbons Company of Algeria
SONIDEP: Nigerien Oil Company
SORAZ: Zinder Refining Company
SW : Shallow Water
TCF: Trillion Cubic Feet (1000 BCF)
TOR: Tema Oil Refinery
UDW: Ultra Deep Water
VSP: Vertical Seismic Profil
WAPCo: West African gaz Pipeline Company
WAPCO: West African Oil Pipeline Company
AfCFTA: African Continental Free Trade Area
Foreword
Geo-extractive resources are a source of income for countries that have them and occupy a large part of the Gross Domestic Product (GDP) of some countries. They have been the basis of the economic and industrial development of many countries. Petroleum resources (oil and natural gas) in particular are strategically important energy sources and played a prominent and decisive role during the Industrial Revolution in the 19th century. In addition to their interest for development, oil resources are also at the origin of environmental disasters, endogenous tensions and wars between certain states. This bipolar dimension or duality characterizing the use of this resource is linked to its multiple uses, which can be grouped into two groups:
Use for socio-economic development:
-
It is a universal medicine used since the 1st century AD: bitumen is prescribed against leprosy, cataracts, gout… It was used in Mesopotamia to cure dermatological ailments and also by the Egyptians and even in the thirteenth century in France.
-
It is the most widely used source of energy for industrial development: In the nineteenth century in Europe and the United States, oil was the driving force behind the development of industry and transport. Today, despite international policies to develop cleaner energy sources, including renewable energy, as well as strategies to limit or even eliminate the exploitation of fossil fuels, hydrocarbons remain the most widely used primary source of energy in the world.
Weapon of war and source of environmental pollution
-
Oil is also a weapon of war: it has been used in the Persian wars between Greece and Persia since the fifth century, as well as in the world wars where energy played a strategic role. For example, the control of Kuwait’s oil reserves by the US was the main cause of the Gulf War (1990-1991). The same is true of the Biafran war in Nigeria (May 1967-January 1970) maintained by France, and more recently in 2011, it was the real motives of the destabilization of Libya by the Western powers that are in particular France animated by the desire to control Libyan oil and to increase its influence in North Africa with the support of other NATO countries particularly the USA.
-
From an environmental point of view, the extraction of hydrocarbons and the use of petroleum products resulting from their transformation are at the origin of climate change because they emit greenhouse gases, which are responsible for global warming which causes severe weather and climate conditions, namely: the melting of glaciers, the rise in sea level, floods, drought etc.
In order to secure this valuable source of energy for industrial development, Westerners undertook oil exploration work in Africa during the 20th century. During the colonial period (before 1960) and especially in the early years of the post-colonial period, the first works carried out by foreign powers made it possible to make the geological mapping of Africa. This mapping revealed that the African continent has a significant potential in geo-extractive resources, particularly oil and natural gas.
The development of oil resources requires the existence and mastery of technology, skills and financial resources that are not available to third world countries, particularly those in Africa. thus. To do this, African countries negotiate agreements with foreign powers whose terms and implementation are poorly controlled or controlled. On the other hand, responsible, sustainable and transparent management of oil revenues by governments is decisive in boosting socio-economic development in states. As a result, for more than three decades of exploitation of oil and gas resources in Africa, the profits they derive are insignificant due on the one hand to the signing of unbalanced contracts that are not very profitable to States and on the other hand poorly managed. This state of affairs is illustrated by three observations:
-
Most African countries that exploit oil resources live below poverty.
-
Half of Africa’s population does not have access to energy, even though it exports a large part of its hydrocarbon production (40% of gas and 50% of oil) in the form of raw materials, according to the International Energy Agency (IEA) in 2017.
-
the lack of appropriate infrastructure for the processing and development of the entire value chain of the oil industry.
The present work aims to lift a corner of the veil on the challenges of African States from the exploration to the exploitation of hydrocarbons, to analyze the tax regimes associated with oil legislation in certain West African countries and finally to highlight the fundamental levers on which States must act to maximize their profit and gradually reverse this unprofitable trend that characterizes the exploitation of oil resources in most countries. countries of West Africa.
This reflection also calls for the responsibility of African States in the monitoring and technical and sovereign control of oil operations in order to optimize their profit margin and ensure compliance with safety and environmental standards accepted in the international oil industry or governed by national legislation.
We believe that we have, through this book, given an overview of the oil sector and the difficulties and challenges related to the exploitation of resources for the benefit of the populations of West Africa, and made our contribution to the development of a real oil industry in West Africa.
This book owes a lot to some people who supported me in this exercise and who gladly made their contributions and constructive comments.
I would like to express my great gratitude to Mr. Matt …., Doctor of Geological Engineering and Independent Consultant in Petroleum Geosciences who did me honor by agreeing to write the preface to this book.
General Introduction
Formed underground between 20 and 350 million years ago, hydrocarbons (oil and natural gas) are and remain the most widely used primary energy source in the world, despite the emergence of renewable energies, which are now considered cleaner energies due to their low carbon footprints. They are a lever for development for nations because of the immensity of the products and by-products as well as the uses that result from the transformation of this raw material.
Over the years, the oil sector has become a real industry that has embraced for its development the engineering sciences (mechanics, electronics, physics, chemistry, mathematics, geology, etc.), legal, economic, political and also social sciences.
The negotiation of exploration and exploitation contracts and the management of oil conflicts require legal, geopolitical and diplomatic knowledge and skills.
The search for oil and its extraction require advanced and innovative technologies that have been developed over time and that are adapted to the geographical and geological environment in which it (oil) was formed.
The possibilities of its extraction and development (processing) are defined by researchers and engineers in petroleum geosciences (petroleum geology and geophysics, geochemistry, drilling, reservoirs), petroleum refining, petrochemicals and economics who carry out technical studies and evaluations of the economic and financial profitability of petroleum projects.
The main purpose of this reflection, which gives a global overview of the oil sector in West Africa, is to question the responsibilities and roles of States as well as to evaluate the benefits that the latter derive from this business vis-à-vis foreign investors from exploration to exploitation, so as to ensure that oil in Africa is no longer as Bruno Carton (2000) so aptly put it, “violence against peoples” or “rent (which) feeds rent and debt” but rather a pledge of peace and a source of prosperity.
This work, structured in three parts and six (6) chapters, deals with the various aspects and themes relating to the policy, governance and management of petroleum resources, as well as the strategy for the development of a viable, integrated and sustained petroleum industry in West Africa.
The first part is devoted to general information on the oil industry and the responsibilities of States in the monitoring and control of oil exploration and exploitation activities.
The second part deals with oil contracts and oil taxation and analyses the different tax regimes used in West Africa.
The third part examined the influence of political stability, governance and corruption on the performance of the oil sector in West Africa.
Specifically, the first chapter addresses the value chain of the hydrocarbon sector. The concepts developed in this chapter are intended for students of petroleum sciences but also for managers and decision-makers in the oil sector at the level of West African States. Mastery of these concepts will enable States to adopt policies and strategies based on the establishment of the necessary technical and infrastructural capacities at the level of all links in the oil chain, from upstream to downstream, in order to place on the market of the Community and world space finished products or, at the very least, semi-finished products resulting from the processing of hydrocarbons.
The second chapter devoted to upstream oil zooms in on oil exploration and exploitation strategies. This chapter thus develops the entire process and techniques that contribute to the allocation of permits as well as to the conduct of hydrocarbon exploration and exploitation operations. It is mainly aimed at students in petroleum geosciences.
The third chapter deals with tax regimes in the oil industry, a very essential theme for students of petroleum sciences but especially for managers and decision-makers in the hydrocarbon sector. The aspects discussed can serve as a guide or guidance in the context of the implementation of legislative and regulatory texts to govern the oil sector, particularly in its fiscal and economic aspects.
The fourth chapter uses the concepts developed in the second and third chapters to make a comparative study of the tax regimes used in six West African countries and to deduce the cash flow and revenues derived by each party (State and contractor) to the contract for the exploitation of petroleum resources.
The fifth chapter examined the socio-political determinants to ensure a good performance of the oil sector before identifying the roles of the various key actors, namely the State, operators or investors and international institutions to prevent political instability, bad governance and corruption in the sector. The topics discussed are useful for policymakers and all actors in the oil sector.
Finally, the sixth chapter provides an in-depth analysis of the situation of political stability, governance and transparency in the management of oil resources in some West African countries and their influence on attracting foreign investment and on the responsible management of oil rents for the benefit of the population.
Chapter 1: Value Chain of the Hydrocarbon Sector
As shown in Figure 1, the value chain of the oil sector or the oil industry includes three segments, namely: upstream, midstream and downstream.
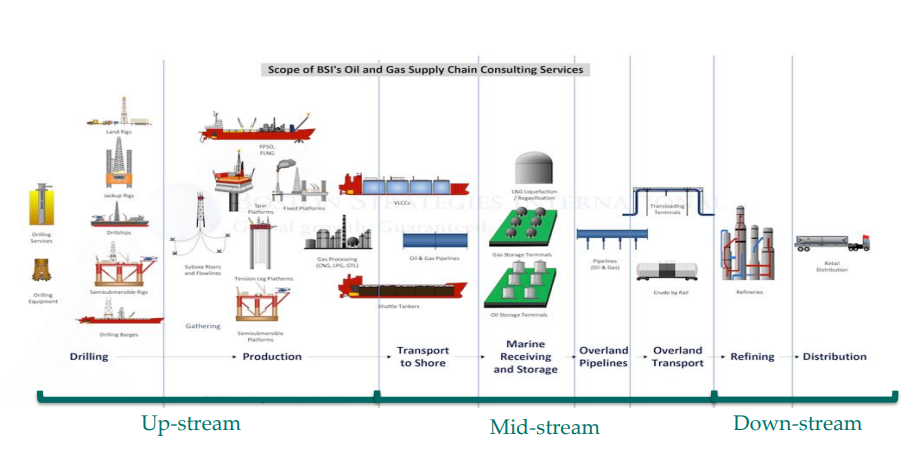
Figure 1: Oil Sector Value Chain
- The Upstream segment
1.1.1 - Features
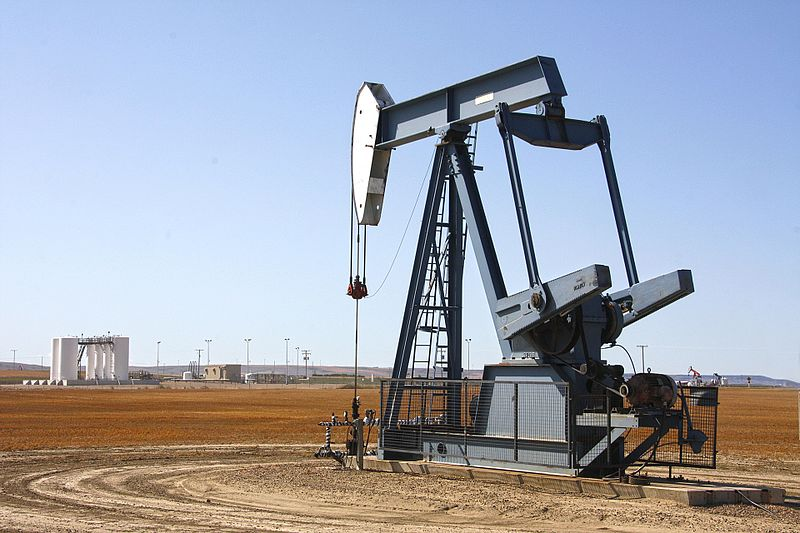
Upstream oil is the foundation or early stages of development of the oil industry. It is characterized by a complex set of operations that contribute to the discovery and exploitation of oil and natural gas formed millions of years ago in the subsoil. The upstream segment essentially includes activities from the exploration to the production of hydrocarbons. It deals with the location of oil and gas extraction sites, exploration drilling and the production of crude oil and natural gas. Three main stages make up this segment:
-
Research or exploration: the identification of hydrocarbon accumulations by various geological and geophysical methods at the surface and depth following the granting of a petroleum licence or authorization;
-
Extraction or exploitation which is composed of two sub-phases:
-
Development: the determination and implementation of technical and infrastructural conditions for extraction according to geological, reservoir and economic parameters
-
The production of the field during which the various techniques of extraction and recovery of oil and natural gas are implemented;
-
-
Abandonment, which generally occurs when oil reserves are depleted and it is necessary to secure and/or dismantle production facilities and infrastructure to avoid and/or minimize various environmental problems inherent in the operation.
The fundamental characteristics of upstream segment operations are:
-
High geological risk, which results in high uncertainty or no guarantee of discovery of commercially exploitable reserves.
-
Colossal investments: exploration and development activities involve heavy capital investments due to the advanced technologies used, equipment and infrastructure necessary to carry out these operations;
-
the management of environmental and safety risks and impacts inherent in research (seismic, drilling, etc.) and production operations (pollution of terrestrial, marine and atmospheric environments by oil spills, flaring, gas leaks and emissions, fires and other construction site accidents).
1.1.2- State of play in West Africa
The West African sub-region holds a third of the continent’s oil and natural gas reserves . About 30% of the world’s oil reserves are in the Gulf of Guinea (ECOWAS, 2019). An assessment of hydrocarbon resources after recent discoveries in some West African countries estimates reserves at about 39 billion barrels of oil and 372,000 billion cubic feet (372 TCF) of natural gas (Table 1).
| Country | Crude Oil Reserves (MMBLS) | Gas Reserves (BCF) |
|---|---|---|
| Nigeria | 30.031* | 202.000* |
| Ghana | 1813 (732 proven) | 4,100 (1,771 proven) |
| Senegal | 2 030* | 42 024* |
| Mauritania | 20 (proven)* | 110 000 (estimation)* |
| Ivory Coast | 3.100 (estimation)* | 4.600 (estimation)* |
| Niger | 150 | |
| Benin | 331 (estimation) | 477 |
| Guinea-Biseau | 840 | |
| Mali | 645 (estimation)** | 9 000 (estimation)** |
| Total | 38 960 | 371 724 |
Table 1: Estimation of hydrocarbon resources in West Africa
*Data Ministries
**RPS Energy Report, 2006
According to Trading Economics (2025), the four (04) largest producers in 2024 (Table 2) are Nigeria (Benin Basin, Niger Delta and intracardboard basins) which is by far the most popular with 1,539,000 barrels/day, followed respectively by Ghana (Saltpond and Tano basins), 188,000 barrels/day, Niger (three intracratonic sedimentary basins, namely Chad, Illumenden, Djado), 53,000 barrels/day and Côte d’Ivoire (offshore coastal sedimentary basin), 47,000 barrels/day.
| Country | Last | Previous | Reference | Unit |
|---|---|---|---|---|
| Nigeria | 1539 | 1485 | 2025-01 | BBL/D/1K |
| Ghana | 188 | 188 | 2024-10 | BBL/D/1K |
| Niger | 53 | 43 | 2024-10 | BBL/D/1K |
| Ivory Coast | 47 | 42 | 2024-10 | BBL/D/1K |
Table 2: Daily production of countries (Trading Economics, 2025)
Significant discoveries of oil and especially gas have been made onshore and offshore in Senegal and Mauritania in the Senegalese and Mauritanian sedimentary basins that are part of a vast West African Basin called “MSGBC Basin (Mauritania – Senegal – Gambia – Bissau – Conakry)”, Fig. 2a. These two states, already oil producers, have started production of a large cross-border gas field thanks to the “Greater Tortue Ahmeyim” offshore gas project, whose resource discovered in 2015 by the American Kosmos Energy is estimated at more than 15,000 billion cubic feet. The field is being developed and produced with the support of the international oil company BP, with the entry of the first LNG cargo on the world market in April 2025.
Benin, located in the Gulf of Guinea, a proven oil-producing province (Fig. 2b), was also a producer from 1982 to 1998 of a marginal field located on Block 1 of its Coastal Sedimentary Basin, discovered in 1968 by the American company Union Oil of California. It has just restarted production from the Sèmè field with Akrake Petroleum, a subsidiary of the Norwegian company Rex, and has relaunched oil exploration.
Other countries are still in the exploration phase and will be able to make commercial discoveries in the sense that they are located in geologically promising areas. These include:
-
The Gambia, Guinea Bissau and Guinea Conakry, which share the same large MSGBC basin as Senegal, have good prospects for commercial discoveries given that the work carried out has proven the presence of hydrocarbons in their coastal basins. The same is true for Sierra Leone and Liberia, which are located in the same geological environment and whose coastal basins are framed by the large MSGBC basin and the Côte d’Ivoire basin in the Gulf of Guinea, where several discoveries have been made.
-
Mali with the Taoudéni Basin, the Nara Rift, the Gao Graben and the Tamesna Basin, which is the extension of the Ilullemedens Basin in Niger (Fig.3). Already in 2006, RPS Energy showed that the five blocks owned by the company Baraka Petroleum in the Taoudéni basin could house up to 645 million barrels of oil and 9 Tcf of natural gas.
-
Burkina Faso in view of its proximity to Mali and because of the presence of hydrocarbon showings identified in its western basin which borders the Nara basin in Mali
-
Togo whose coastal sedimentary basin is an integral part of the Gulf of Guinea, an oil-rich province proven by discoveries in Nigeria and Benin, Ghana and Côte d’Ivoire.
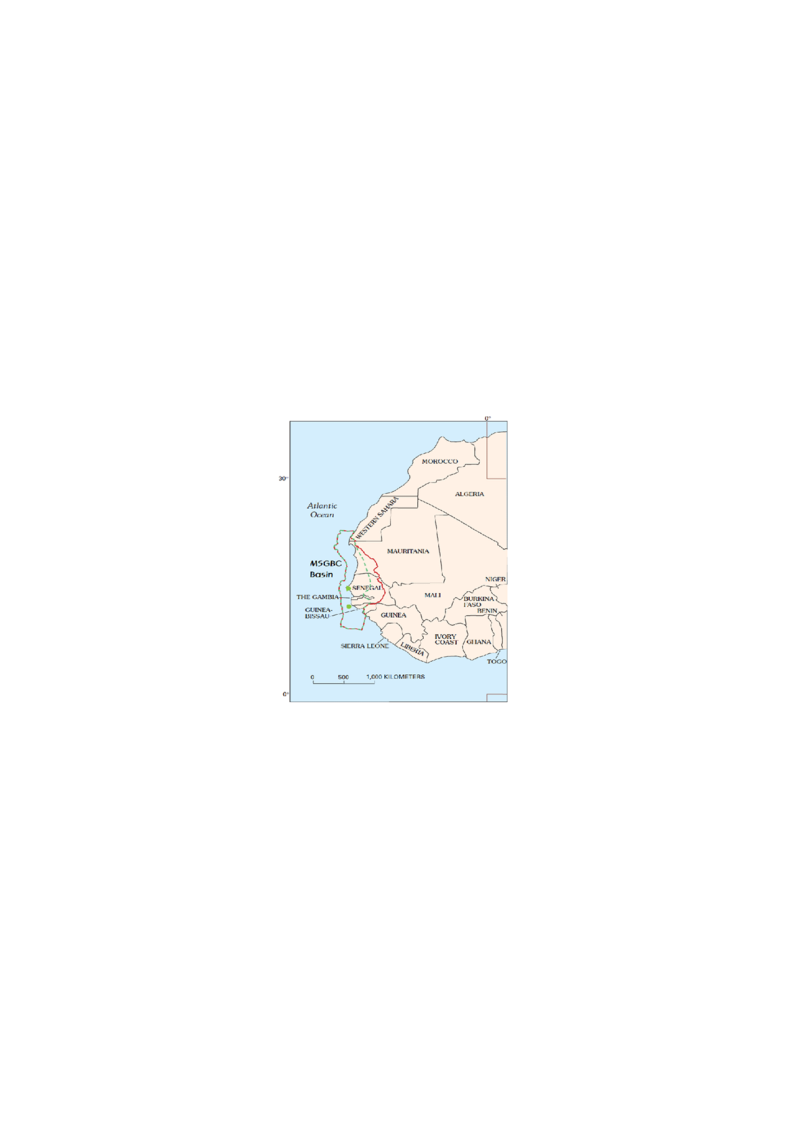
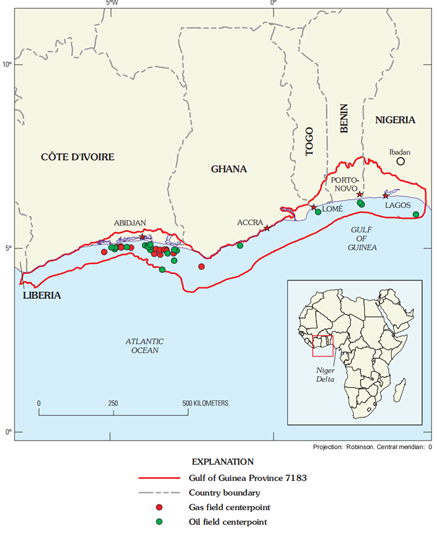
Figure 2: a and b Map showing the MSGBC Basin and Map showing the basins of the northern part of the Gulf of Guinea in West Africa
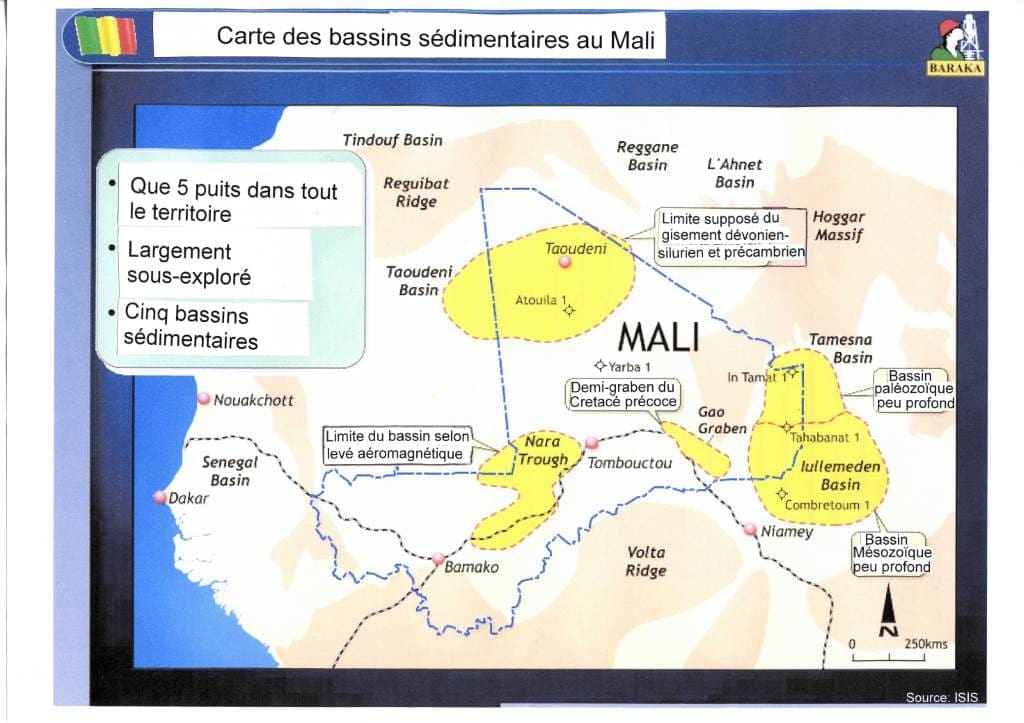
Figure 3: Map showing the sedimentary basins of Mali and Niger
Crudes discovered and produced in some West African countries are light to heavy with a low sulfur content (sweet) as mentioned in Table 3 below.
Table 3: Type of crude oil in selected West African countries
| Country | Density °API | Sulphur content (%) | Quality |
|---|---|---|---|
| Benin | 22 (Champ de Sèmè) | 0.32 | Medium and Sweet |
| 42 (Deep Offshore Block) | 0,1 | Light and Sweet | |
| Niger | 30 | Very Low | Medium and Sweet |
| Nigeria (Niger Delta Crude) | 20 to 25 |
0.17% Egina 0.6% (Qua Iboe et Forcados) |
Heavy, Medium and Sweet |
| 36 | Light and Sweet | ||
| Ivory Coast | 28, 31, 48 | Medium, Light and Sweet | |
| Ghana | 35,1 (Saltpont) | 0.16 | Light and Sweet |
| 35 (Jubelee) | 0.23 | Light and Sweet |
Some examples of internationally known upstream companies are ExxonMobil, Chevron, BP, Shell, ConocoPhillips, ENI, Total Energies, SINOPEC… These majors are joined by other independent oil companies that are challenging and investing in West Africa, such as Tullow in Ghana, Cairn in Senegal, Kosmos in Mauritania, CONOIL in Nigeria, CNPC in Niger, etc. In Africa, there is an emergence of National Hydrocarbon Companies such as SONATRACH in Algeria, PETROCI in Côte d’Ivoire, NNPC in Nigeria, SONAGOL in Angola, PETROSEN in Senegal, SONIDEP in Niger, GNPC in Ghana… but also some small private companies such as SAPETRO, ORANTO in Nigeria….
1.1.3- Main challenges
Faced with the issue of climate change, the challenges related to the financing of upstream activities, the development or the appropriation of technology remain a bone in the throat of African States and to which States must cooperate and pool their efforts in order to put in place appropriate strategies for the responsible and sustainable exploitation of their hydrocarbon resources.
- The midstream segment
1.2.1- Characteristics
The midstream segment of the oil and gas industry connects upstream and downstream oil activities and includes natural gas liquefaction and regasification operations, natural gas storage and transportation, and transportation of crude oil to refineries by means of ships, pipelines, tanker trucks, etc.
In detail, the intermediate segment includes activities related to:
-
the construction of oil and gas pipelines, crude oil and natural gas storage tanks, oil and gas loading terminals, and natural gas liquefaction and regasification facilities, including:
-
Flootload Liquefied Natural Gas (FLNG) units
-
Floating Storage and Regasification Units (FSRUs)
-
-
the transport of hydrocarbons by pipelines (oil and gas pipelines, etc.)
-
to the treatment of natural gas by separating it from the various hydrocarbons and fluids to produce a “pipeline quality” gas. In some cases, this activity may be considered to be an upstream oil activity
Crude oil and natural gas are transported either by land or by sea. The means of transportation typically used are tankers and pipelines that bring crude oil to refineries where it will be processed into petroleum products.
The term midstream is much more used in the oil industry in the US and Canada, which have developed large oil and gas pipelines and storage facilities run by private companies in these countries. For example, the Keystone Pipeline System is a network of oil pipelines in Canada and the United States, owned by TransCanada Corporation.
In European countries, the transportation and storage of crude oil tends to be integrated into upstream production activity. Many European pipelines are controlled by the governments of the countries they pass through or by state-owned crude oil transport companies in these countries. This state ownership tends to result in the absence of the midstream as a separately designated part of the oil production value chain.
Some examples of purely mid-market operating companies are Oasis Midstream Partners, Sanchez Midstream Partners, Hess Midstream, Magellan Midstream Partners, and EQT Midstream Partners. TransCanada Corporation.
1.2.2- State of play in West Africa
In West Africa, the transport network by gas and oil pipelines is still very weak. However, it should be noted that States are aware of the situation and that they are willing to develop structuring projects to secure the supply of hydrocarbons to the West African area.
The West African Gas Pipeline (WAG) and the Niger-Benin Export Pipeline are good examples of midstream development projects in this West African region.
The West African Gas Pipeline (WAG) is a natural gas pipeline transport system (onshore and offshore), over approximately 688.6 km from Nigeria (Alagbado) to Ghana (Takoradi) via Benin (Cotonou) and Togo (Lomé). Its objective is to transport natural gas produced in large quantities from Nigeria’s oil fields to Benin, Togo and Ghana, mainly for the production of electricity and the needs of the industrial sector. This pipeline, managed by the West African Gas Pipeline Company (WAPCo), has been operational since 2011 and aims to increase the population’s access to electrical energy at a reasonable cost and consequently give a boost to the economic development of states.
The Niger-Benin Export Pipeline is a pipeline transport system to export crude oil from AGADEM’s fields located in the DIFFA region of Niger via Benin through a loading terminal located at sea. This pipeline was built and is managed by the Chinese company WAPCO. It is the longest in the sub-region, has a length of 1,950 km, of which 675 km is on Beninese territory, and has a transport capacity of 90,000 barrels/day, extendable up to 140,000 barrels depending on discoveries in Niger.
In addition to these cross-border infrastructures, there are national oil and gas pipeline transport networks and crude oil storage infrastructures which are more or less developed in some countries such as Nigeria, Côte d’Ivoire, etc.
1.2.3- Main challenges
Challenges in the midstream sector include, among others, maintaining the integrity of storage and transport infrastructure (ships, trucks, wagons, pipelines, etc.), protecting workers involved in cleaning, purging and filling activities, and the lack of oil infrastructure to ensure the energy security of states.
In West Africa, the issue of securing infrastructure is worrying and topical. Security challenges are manifested by:
-
the vandalism of infrastructure due to the failure to take into account the socio-political realities and misery of the populations of the localities in which these sensitive and dangerous infrastructures are built;
-
acts of sabotage of facilities recorded by the growing rise of terrorism
To this end, the monitoring of these infrastructures and the real consideration of the concerns of indigenous populations must be considered more seriously in the context of oil and gas development projects. Taking these aspects into account will ensure the safety of workers and machines and avoid the risks of vandalism and sabotage of infrastructure that are the cause of oil spills, fires and explosions and consequently marine and terrestrial pollution.
The inadequacy and poor management of national and regional oil infrastructure for the transport and storage of hydrocarbons, liquefaction, regasification and gas processing is also a major weakness of the oil sector in West Africa.
The strengthening or construction of energy infrastructure such as gas-fired power plants and the creation of an African oil market will boost the development of the midstream and, in turn, strengthen people’s access to clean energy.
- Le segment Aval (downstream)
1.3.1- Characteristics
This segment deals with crude oil refining, transportation, storage and distribution of petroleum products as well as petrochemical activities. This is the stage where crude oil is transformed into different petroleum products namely fuel oil, diesel, gasoline (naphtha), kerosene (jet A1) and Liquefied Petroleum Gas (LPG) which are used for various purposes, such as powering vehicles, heating homes, electricity production etc. and asphalt or bitumen for road construction (Figure 4). The crude oil refining process is generally divided into three basic stages: separation, conversion, and processing. Refining techniques depend on the type of crude oil to be processed and the needs of the market. There are several types of crude oil classified mainly according to three criteria: density, sulphur content and geographical origin**.** API low-density and low-sulfur crudes have the best advantages because they are lightweight and less complex to refine and require little or no desulfurization.
In the petrochemical industry, long-chain hydrocarbons in oil and natural gas and naphtha are used to manufacture products such as plastics, rubbers and synthetic fibres, fertilizers, preservatives and detergents. For example, petroleum and natural gas products are used to make artificial limbs, hearing aids, and flame-retardant clothing to protect firefighters. Similarly, paints, dyes, fibers, etc. are made from oil and natural gas.
1.3.2- State of play in West Africa
In West Africa, the performance and quantity of refining units and infrastructure for the storage and transport of petroleum products remain problematic in that they are insufficient to cover fuel needs and ensure the security of supply of petroleum products. Thus, despite its great oil potential and the significant amount of oil production, most West African producing countries remain dependent on Europe and the Middle East for their supply of petroleum products, which constitutes an exorbitant bill for public finances.
This analysis is also confirmed by a study carried out in 2019 by ECOWAS on “the development of a regional programme on the facilitation of the supply of petroleum products”. The study found that: “The supply of petroleum products is highly dependent on external sources, resulting in a 70/30 import/local production ratio that does not guarantee security. The available refining capacity theoretically makes it possible to cover the demand for refined products… Unfortunately, the refineries are underutilized. They are only at 30% of their production capacity due to the obsolescence of poorly maintained equipment.”
In addition, the use of low-quality petroleum products is responsible for the emission of air pollutants such as carbon monoxides, benzenes, unburned hydrocarbons, particulate matter, nitrogen oxides, etc., which dangerously compromise human health, engine efficiency and the environment. Unfortunately, there is a large deviation from the specifications of petroleum products in Europe and West Africa. European standards have a sulphur content of 10 ppm for petrol and diesel oil, while almost all West African countries import or produce these products through their refineries with a sulphur content of 50 and 10,000 ppm for diesel and 50 and 3500 ppm for petrol, with the exception of Ghana and Benin, which have adopted better specifications in their legislation.pursuant to Directive C/DIR.1/9/2020 on harmonized specifications for automotive fuels (petrol and diesel) in the ECOWAS region. Bringing refineries in West Africa up to standard is becoming an imperative but requires huge investments that governments and their partners must face.
The actors in the supply and distribution of products in West Africa are made up of state companies or institutions, mixed companies, private and international. In addition to state-owned companies such as PETROCI and GESTOCI of Côte d’Ivoire, NNPC of Nigeria, PETROSEN in Senegal, GNPC in Ghana, DPB in Benin, SONIDEP in Niger, international traders such as Oryx, PUMA/Trafigura, Vitol and African traders such as La Chorale in Côte d’Ivoire, Sahara Group in Nigeria, ITOC in Senegal and private national storage and distribution companies such as Octagone, JNP, Benin Petro in Benin, BOST and GOCIL in Ghana…
As far as the refining industry is concerned, there are very few private companies in West Africa (the new DANGOTE refining company in Lekki, Nigeria, with an optimal capacity of 650,000 barrels per day, and a few state-owned or mixed refineries such as SIR/SMB in Côte d’Ivoire, SAR in Senegal, the NNPC refineries (Kaduna, Port Harcourt and Warri) in Nigeria, SORAZ in Niger, TOR in Tema in Ghana.
1.3.3- Main Challenges
In short, Africa in general is facing two major challenges in the downstream oil sector, namely:
-
the weakness of the security of supply of petroleum products, which limits access to energy and, in turn, is a brake on economic development, particularly in most countries of sub-Saharan Africa. This situation is linked to a lack of storage and distribution infrastructure and also to the weakness of the operational capacity for oil refining.
-
the poor quality of imported petroleum products and those from African refineries that do not meet international standards, with the exception of the new DANGOTE refinery in Nigeria.
- Weaknesses in the West African oil industry value chain
The value chain of the oil industry is not structured in Africa in general and in West Africa in particular. The oil sector faces challenges due to a lack of a coherent and operational regional organizational policy, a lack of synergy between the different segments of the oil industry, and the lack of a genuine African oil market serving Africans. The upstream oil sector is therefore characterized by a massive export of oil and gas resources produced to Europe and Asia in raw form and an import of refined and finished products. As a result, the oil sector is still subject to the dictates of foreign powers marked by:
-
A massive export of crude oil at a market price over which Africa has no control;
-
A steep and bitter bill for importing refined products and derivatives from their crude oil at a price whose setting mechanism escapes Africans.
In addition, the poor management of revenues from resource exploitation is also an obstacle to the endogenous financing of structuring development projects in Africa. It is important to draw the attention of States to the responsible management of revenues from the exploitation of oil and gas resources, given that most of Africa’s producing States are confronted with the “Dutch disease”, characterized above all by deindustrialization and their economic dependence on oil rents.
Indeed, the revenues derived from the exploitation of oil and natural gas, non-renewable extractive resources, should be directed and invested in the diversification of the economy with a view to the emergence of other viable economic and industrial sectors that make it possible to sustainably support the development of States.
Unfortunately, many African countries have economies that remain very fragile because they rely mainly on oil and natural gas production. In 2024, Libya is in the lead, with an impressive 56% of its GDP coming from oil rents, followed by Congo with 34% and Angola with 28%. Nigeria’s contribution to reported GDP of about 6% while more than 90% of its total export revenues came from oil shows a disparity between the direct contribution to GDP and the preponderance in export earnings and public finances. This situation reveals that Nigeria remains inherently dependent on oil and gas for its essential foreign exchange inflows and national budget.
The diversification of the economy is a major approach to avoid the risks of economic fragility linked to total dependence on oil resources, which are suffering the full force of the threats of oil counter-shocks, endogenous and exogenous geopolitical tensions, etc., but also of their certain depletion.
African regional institutions such as ECOWAS through its specific bodies and sectoral commissions, AFREC and APPO have a key role to play in establishing a link between the different segments of the industry in order to develop an integrated value chain for the optimization and generation of economies of scale to contribute to the industrialization and diversification of energy sources in the region.
1.4.1- At the ECOWAS level
In West Africa, the issue of pooling efforts and genuine cooperation for the development of an oil industry remains a challenge despite some ongoing actions. ECOWAS should be a springboard for the realization of these actions. The results obtained by this West African organization are not yet up to expectations. One of the flagship projects carried out by ECOWAS is the construction of the West African Gas Pipeline (WAG). Unfortunately, despite Nigeria’s natural gas potential, supported by Ghana’s recent discoveries, this project is struggling to supply gas to the other countries that have signed the GAO treaty, namely Nigeria, Benin, Togo and Ghana and the question of natural gas supply for the production of electricity is acutely important in these countries.
This project is in the process of being merged into the framework of the Atlantic African Gas Pipeline Project (AAGP) which will be the merger of the West African Gas Pipeline Extension Project (WAGPEP) and the Nigeria-Morocco Gas Pipeline Project (NMGP) into a Single Sub-Regional Gas Pipeline Project that will cross thirteen (12) West African countries and Morocco to finally serve the European market.
This means that this Nigeria-Morocco gas pipeline initiative, although commendable, deserves to be re-examined through the evaluation of the commitments of the various parties and the definition of a more unifying project policy and governance body that will guarantee the production, sale and purchase of natural gas first and foremost for our needs in West Africa. and subsequently in Africa in general, before considering supplying gas to markets outside Africa. It is important to mature this African Atlantic Gas Pipeline Project (AAGP) in order to prevent it from simply not being used to make Morocco a hub for the transit and supply of natural gas to Europe to the detriment of the ever-growing needs of Africa in general and sub-Saharan Africa in particular.
1.4.2- At the level of the APPO
At the continental level, the African Petroleum Producers Organization (APPO), which is a specialized institution created in 1987, has struggled to find its feet and remains today an organization with no significant impact on the development of oil activities in Africa. This noble initiative of the founding fathers (Algeria, Angola, Benin, Cameroon, Congo, Gabon, Libya, Nigeria), was born from the observation that, despite the abundance of hydrocarbon resources on the continent, African countries remain largely dependent on foreign multinationals for the exploration, exploitation and marketing of their oil. The fundamental objective of the APPO was therefore to promote technical cooperation between member states in order to strengthen their control over their oil resources and maximize the benefits derived from their exploitation for the socio-economic development of their populations. In more than 30 years of existence, no viable structuring project has been carried out under the aegis of the APPO through its bodies.
This organization also deserves to be rethought through the redefinition of its objectives and bodies in order to be more operational to solve the problems listed above faced by the different segments of the value chain of the hydrocarbon sector in Africa.
- Possible solutions for an oil industry serving the region
The need for a reorganization of the entire value chain is a solution to boost development in Africa. This reorganization involves:
-
the establishment of a structure and an endogenous financing strategy for oil exploration and production projects;
-
the development of petroleum infrastructure for the storage and transport of hydrocarbons. The establishment of such an infrastructure network will facilitate the supply of hydrocarbons in the different regions of Africa;
-
the realization of common energy structuring projects allowing the production of energy for the benefit of African populations, more than half of whom do not yet have energy. These projects will enable the development of the entire value chain of the hydrocarbon sector
-
the construction of regional refineries in accordance with environmental standards in the current context of climate change and related infrastructure;
-
the creation of specialized training centers for petroleum professions;
-
the development of healthy cooperation between States in terms of sharing experience.
Figure 4: Synthetic diagram showing the different oil cuts
0 to 80-100°C
120 to 180°C
Chapter 2: Different Phases of Upstream Oil and the Roles of States
The Upstream Oil sector includes five (05) categories of activities or phases that follow one another (Figure 5): Pre-licence, Exploration, Development, Production and Abandonment.
Figure 5: Different phases of upstream oil
Authorization to operate
Exploration Authorization
- Pre-licensing phase
2.1.1- Definition of the concept
During this phase, the State puts in place the policy as well as the regulatory and technical tools necessary for oil exploration, promotion, allocation of oil blocks, management and monitoring of contracts/authorizations or licenses as well as environmental management related to the realization of oil exploration and exploitation activities.
The pre-bachelor’s degree stage addresses, among other things, aspects relating to:
-
preliminary geological and geophysical reconnaissance or prospecting studies (gravimetry, magnetometry, speculative seismic, etc.), the objective of which is to define the areas suitable for exploration and to assess their oil potential;
-
the establishment of laws and regulations that should clarify the main areas of concern for both the investor(s) and the host government. This will enable the host Government to ensure better monitoring and proper management of contracts and to effectively monitor revenue forecasts through the establishment of an appropriate and mutually beneficial tax and legal regime.
-
the delimitation of maritime and land borders as well as the mechanism for managing border conflicts in oil zones common to two or more States;
-
the management of the involvement of local communities and the expectations of the populations.
Once the areas potentially favourable to oil exploration have been known and the oil potential assessed, the technical and environmental laws and regulations and the tools for awarding and managing oil contracts have been developed, States can proceed to allocate perimeters for exploration.
The issuance of a petroleum licence or authorization follows the process outlined in Figure 4 below. It starts with promotional activities until a contract is signed and/or an authorization is issued that gives the IPCs the right to explore and exploit hydrocarbons in a well-defined area commonly known as an oil block.
- Strategy for awarding petroleum licences or authorizations
Promotion is the operation of attracting investors in oil exploration and exploitation. Countries with oil potential and wishing to embark on the development of their oil resources must prepare and/or regularly update petroleum promotion documents. A promotion file must contain the following documents:
-
Petroleum legislation
-
The contract model
-
The list and price of available oil data if required. Some countries make data available to oil companies free of charge to be more attractive
-
Information on the oil potential and/or a technical assessment report of the oil potential
-
Perimeters or blocks on promotion
-
Information on available oil infrastructure
-
The institutional framework of the hydrocarbon sector and contacts of the structures in charge of this sector
-
The Tender Calendar
-
Pre-qualification criteria
-
Evaluation criteria
The different stages of the allocation of oil blocks are (Figure 6):
-
Announcement of the exploration area or blocks on promotion
-
Launch of the call for tenders: the launch of a call for tenders makes it possible to have several offers on the same domain or block; this makes it possible to make comparisons in order to choose the most interesting offers for the State. However, it is not excluded that the State will decide to examine, on the basis of its expectations, the unsolicited offers of companies that show an interest in a given block.
-
The definition of the pre-qualification criteria: the pre-qualification constitutes a first filter of the oil companies on the basis of criteria previously defined by the States in order to identify the oil companies or consortium capable of playing a relevant role in the field where the blocks are auctioned; These criteria generally relate to the financial, technical, security and environmental management capacities of oil companies
-
Submission of tenders: this consists of the submission of applications by oil companies that are interested in oil exploration in the fields open to tendering
-
Analysis/evaluation of tenders: this is done on the basis of the award criteria developed by the Government.
-
Allocation of the block: this is done after negotiation of the technical and economic terms with the CPIs who present the best offers on the basis of the State’s expectations. The technical and fiscal terms that may be subject to negotiation and that condition the final allocation are:
-
Work obligations
-
Retrocession or surface rendering
-
Local Content and Training
-
Socio-community development
-
Signing and Exploitation Bonuses
-
Royalties
-
State participation,
-
The cost stop rate
-
The key to sharing oil profit, etc.
-
Oil negotiations require good preparation and professionalism on the part of the Government. It is carried out by a multidisciplinary team which must include, but is not limited to, players with a good knowledge of oil contracts and negotiation techniques as well as technicians experienced in the sector. This team can be made up of lawyers, oil economists, geoscientists, etc.
Figure 6: Process for Assigning Oil Block to the IPC for Petroleum Exploration and Development
All in all, pre-licensing activities are necessary because they condition the decision of governments whether or not to engage in oil exploration activities.
This was the beginning of investments in the hydrocarbon sector.
- Financing of pre-licensing phase investments
As a general rule, pre-licensing activities are under the sovereignty of the host state. The implementation of policy documents, legislation and regulations, as well as the assessment of oil potential and the implementation of tools and strategies to move to exploration via international oil companies are the responsibility of States and require relatively less expensive investments than those relating to exploration activities. States with financial resources and competences directly finance all these activities (Norway for example). However, those with limited financial resources and no required skills are accompanied for certain pre-licensing activities by service companies to carry out the first reconnaissance and evaluation studies of the oil potential in order to have first-hand information before engaging in promotional activities that lead to the signing of exploration and exploitation contracts with oil companies. These service companies usually acquire the data at their own expense on the basis of a service contract and market and market it to international oil companies.
- Importance of the pre-licensing phase and responsibilities of the State
The pre-licensing phase is very essential in the sense that the lack of knowledge of its oil potential and the non-existence from the outset of all the clear regulations, procedures and tools for the management of upstream oil activities are detrimental to the signing of fair and beneficial contracts for the State.
“You can never sell a packaged good at its fair value, i.e. very little or poorly known .”
The non-or poor preparation of the pre-licensing phase thus leads to harmful consequences for States during the execution of oil operations, where they are confronted with legal and contract management difficulties.
Unfortunately, most African countries neglect this phase and engage in the exploration and exploitation of oil resources without any necessary safeguards by signing contracts whose revenue sharing is often unfavorable or very unprofitable following the discoveries. The lack or inadequacy of proper preparation for the pre-licensing phase, which is essential for the implementation of tools for managing and monitoring contracts before engaging in oil activities (which contributes to the development of resources), is often one of the fundamental causes of the signing of “one-sided contracts” with foreign partners in the geo-extractive sector in general and in the oil industry in particular in Africa.
- Exploration phase
2.2.1- Exploration methods and strategies
Exploration is the phase of upstream oil activities that consists of the search for hydrocarbons in the subsoil using geological and geophysical methods, including seismic methods, and the drilling of exploratory wells. Initially, the research consisted of drilling near natural surface showings; This only made it possible to discover small deposits, close to the surface.
Today, it is undertaken by the International Oil Companies (IPC) which have developed several exploration methods and technologies from the simplest to the most sophisticated for the discovery of hydrocarbons at great depths both on land and in very deep seas (beyond 3 km of bathymetry).
The activities concerned by the exploration are, among others:
-
Surface geological research
-
Gravimetry,
-
Magnetometry
-
Aerial photography
-
Seismic
-
Electromagnetism (EM) or Control Source Electro-Magnetic (CSEM)
-
Exploration drilling
Gravimetry and magnetometry help to identify areas of geophysical anomalies where other, more precise methods can be applied to locate hydrocarbons. They make it possible to determine the nature and depth of the sedimentary layers and thus give an idea of the distribution and thickness of the sedimentary formations (Figure 7 a and b).
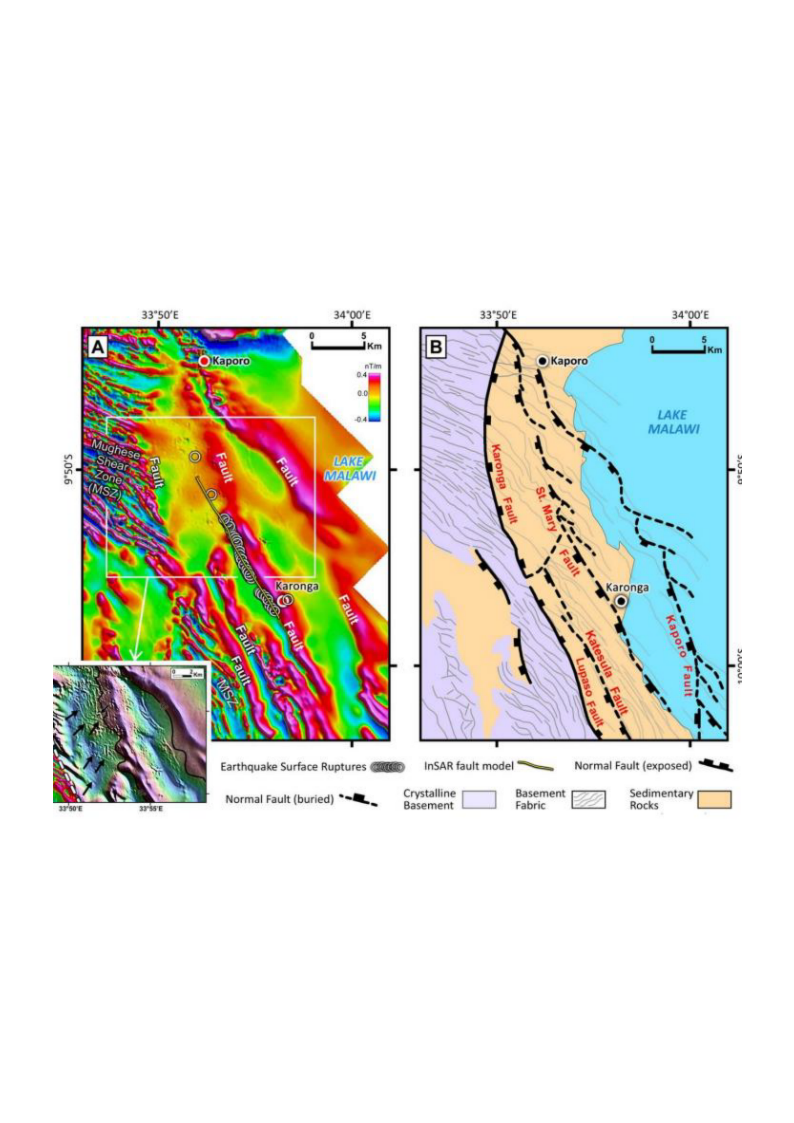
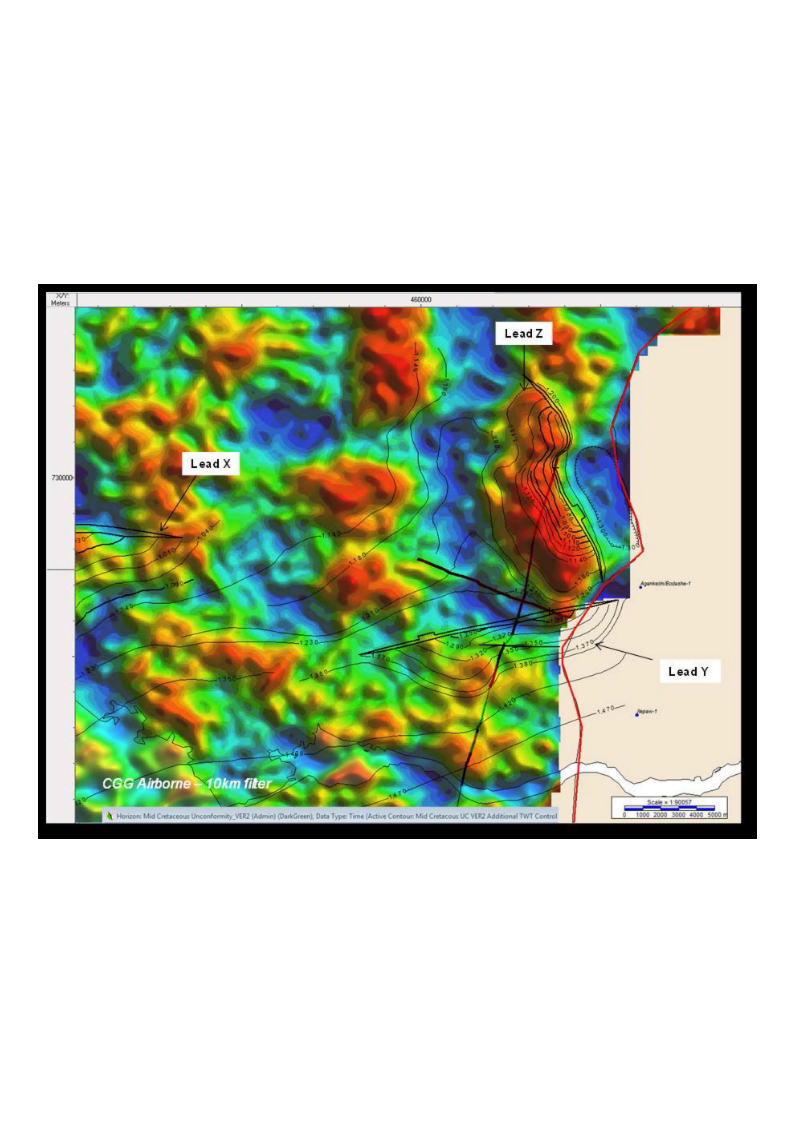
Figure 7: Gravimetric acquisition (a) showing anomalies in the Coastal Sedimentary Basin of Benin (CGG 2013) and aeromagnetic (b) to characterize the basement and sedimentary formations
Seismic reflection, the most commonly used method before exploratory drilling. The principle of seismic acquisition consists of sending sound waves into the ground that are reflected by the different rock surfaces. The time taken by the waves to come to the surface and to be recorded by geophones (when the operation takes place on land) or hydrophones (when the operation takes place at sea) indicates the depth of the rocks crossed (Figure 8a, b). Seismics can be carried out in two 2D dimensions and for more than half a century in three 3D and even four 4D dimensions. Seismic also provides information on the nature of the rocks from the analysis of the different transmission speeds noted at the level of the different types of rocks. The analysis and interpretation of seismic data also allows the identification of hydrocarbon traps and Direct Hydrocarbon Indicators (HIDs) such as Bright Spots, Flat Spots and Gas chimneys etc. which condition the positioning of exploration wells (Figure 9).
b
a
Multiple qv streamers
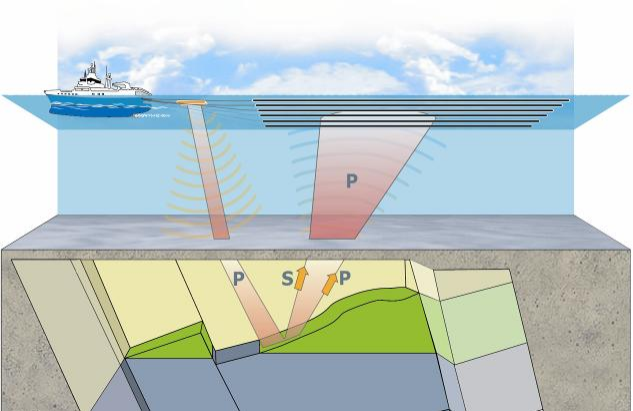
Source
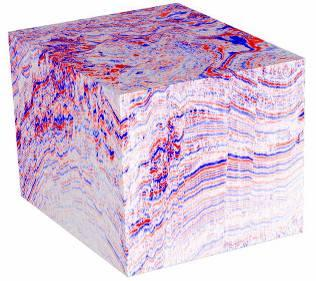
Figure 8: 3D acquisition principle (a) and seismic cube (b)
Well Positioning
Exploratory
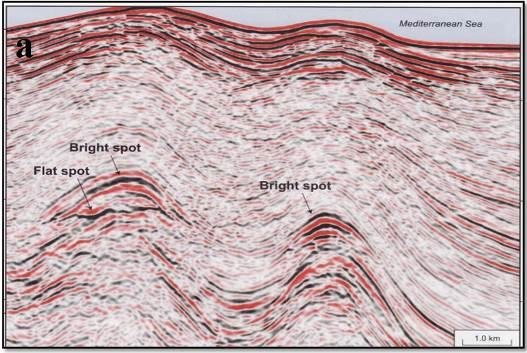
Figure 9: Seismic amplitude anomalies showing Brightspots and Flatspots
CSEM is a technology developed that measures resistivity contrast in the seabed. The acquisition of EM is generally done on the prospects/traps already identified by the seismic in order to have a precision on the nature of the fluid contained in the traps. Indeed, the areas of oil traps have a high resistivity while the rocks around the traps are conductive because they generally contain salt water (Figure 10). This technology makes it possible to determine whether or not there is a resistivity contrast in regions where traps have been mapped in order to maximize the chances of success of exploratory wells.
Positioning an exploratory well
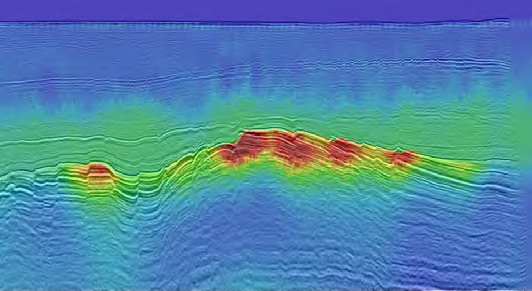
Figure 10: Electromagnetism coupled with seismic reflection showing the contrast of resistivity at the level of the traps highlighted by the seismic
Exploratory drilling is the ultimate and very expensive step in exploration that makes it possible to confirm or refute the predictions of exploration geologists and geophysicists.
The duration of an exploration license varies from 7 to 9 years in West African countries.
2.2.2- Techniques for evaluating a prospect
Oil exploration is based on four fundamental principles, namely: the search for the existence of a petroleum system in the licensed area by the various research methods mentioned above, the identification and mapping of geological structures likely to contain hydrocarbons (Plays, leads and prospects), the assessment of the geological risks associated with the mapped structures and finally the volumetric estimation of the potential for petroleum resources.
- Petroleum system
The petroleum system is the whole of source rocks, reservoir rocks, cover rocks and overload rocks as well as the entire process of trap formation, generation, migration, accumulation and preservation hydrocarbons (Figures 11 and 12). These essential geological factors and process must take place in time and space so that the organic matter contained in the source rock can turn into an accumulation of oil (Magoon & Dow, 1994).
It should be noted that this organic matter from which oil was formed, several million years ago, is the result of the decomposition, under the effect of sedimentary subsidence pressure and geothermal temperature, of microscopic animals and plants (phytoplankton and zooplankton) that lived in the sea.
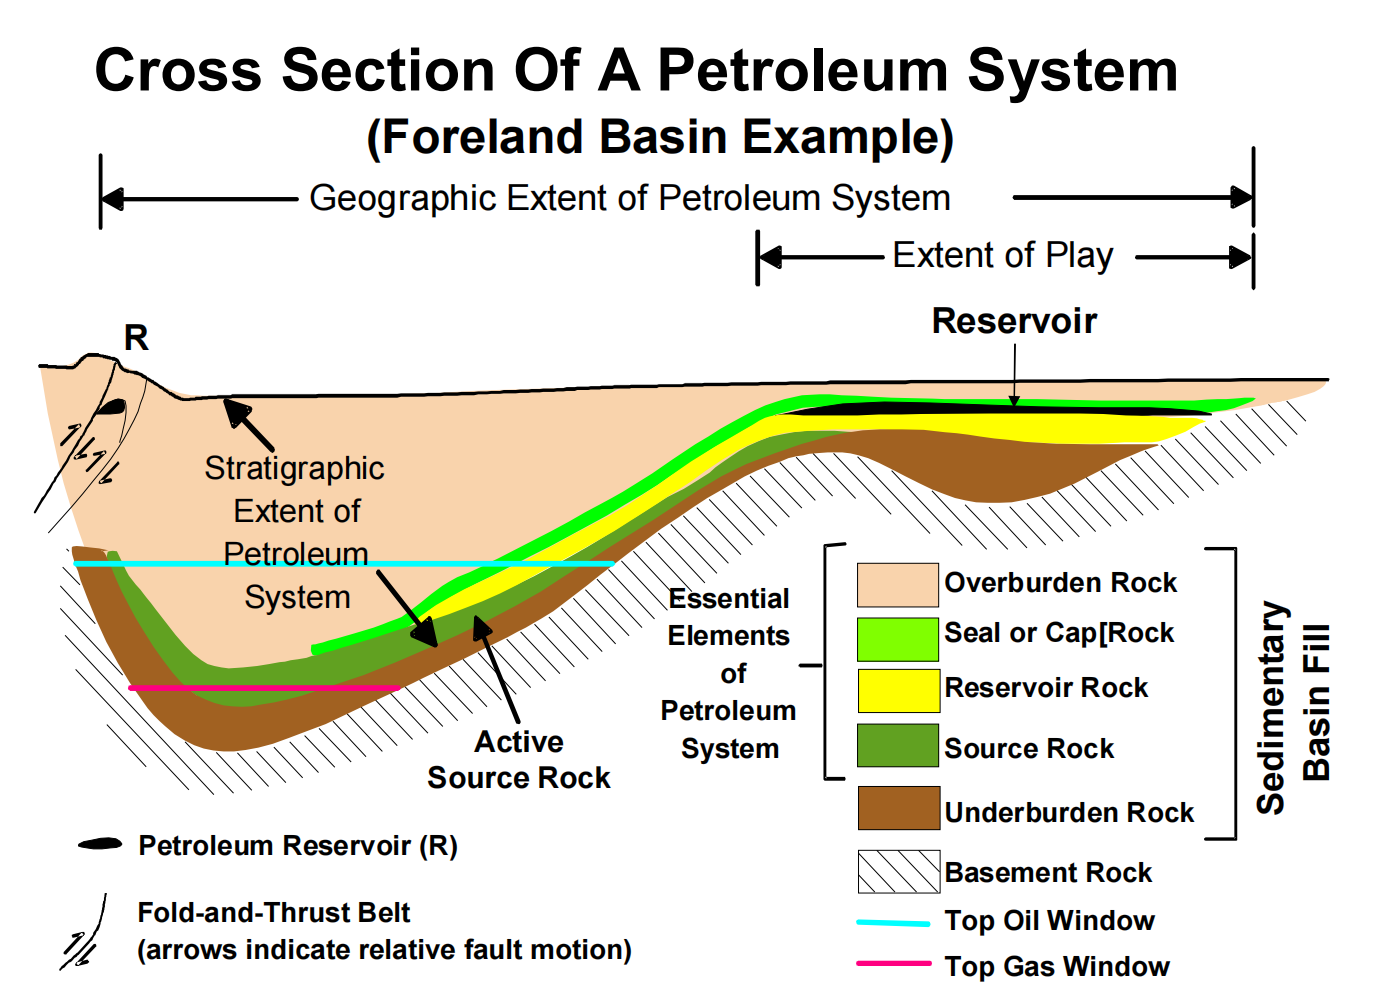
Figure 11: Geological section showing the stratigraphic extent of a fictitious petroleum system (Magoon and Dow, 1994, modified by Schlumberger)
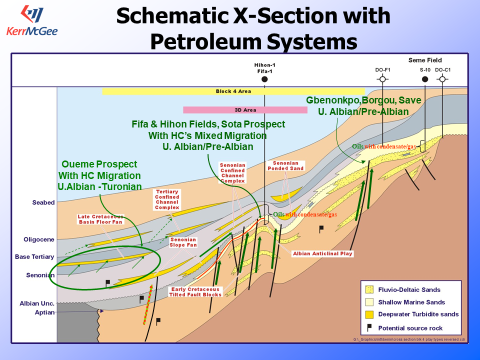
Figure 12: Geoseismic section showing petroleum systems in the Benin Coastal Sedimentary Basin, Kerr McGee, 2003
- Identification and mapping of geological traps likely to contain hydrocarbons
Geophysicists and geologists process and interpret the data acquired by the various research methods in order to identify hydrocarbon traps (Figure 13), HIDs or any other geological anomalies that make it possible to suspect the presence of hydrocarbons and that make it possible to guide the positioning of exploratory wells.
Hydrocarbon traps can be structural, stratigraphic or mixed depending on their formation mechanism.
Structural traps can be formed by regional tectonic mechanisms (fault, anticline, etc.) or by salt tectonics (halokinesis). Stratigraphic traps result from depositional conditions, i.e. are formed by sedimentary processes (unconformity, lateral change of facies, bevel, etc.) (Figure 14).
The identified traps are then mapped using software in order to assess their geometry and assess their size (Figure 15).
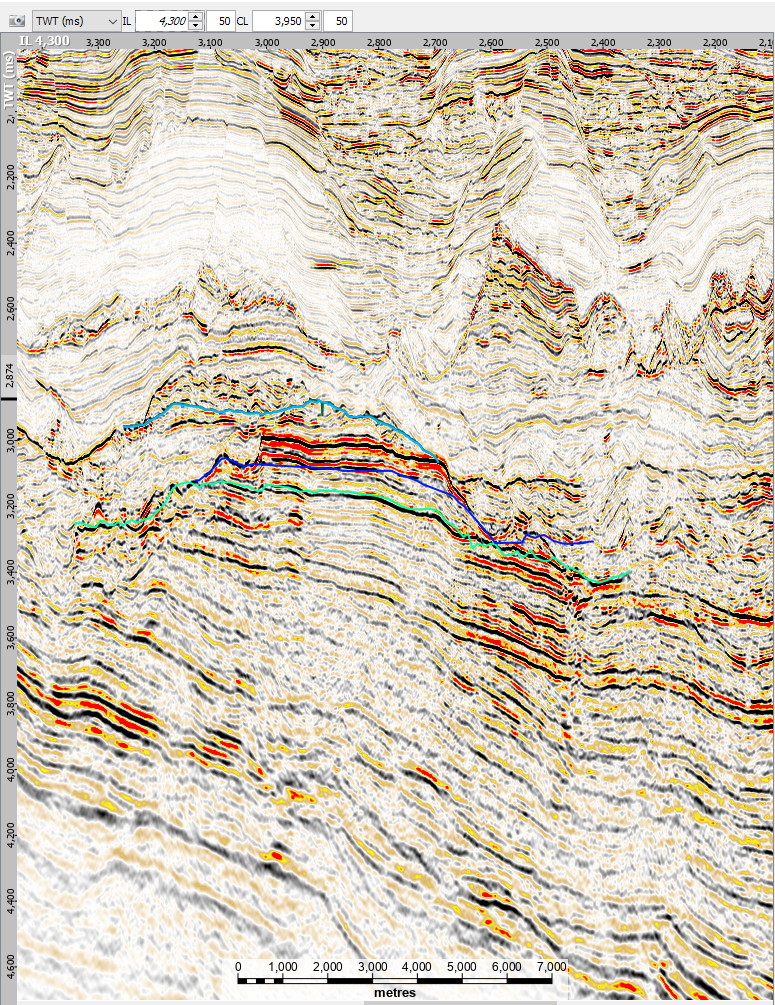
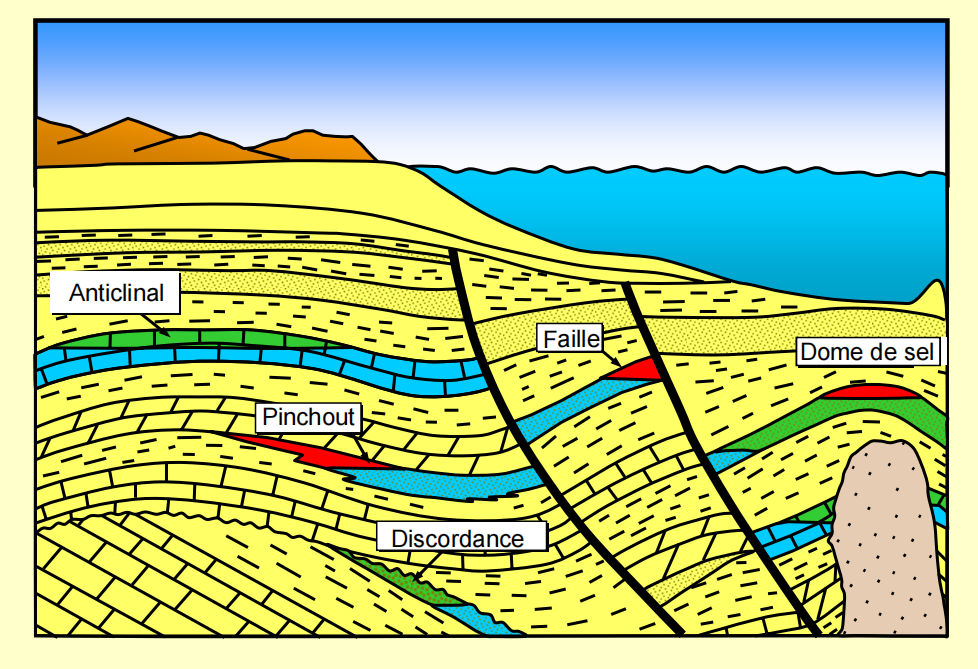
Figure 13: Seismic interpretation showing a structural trap (anticline)
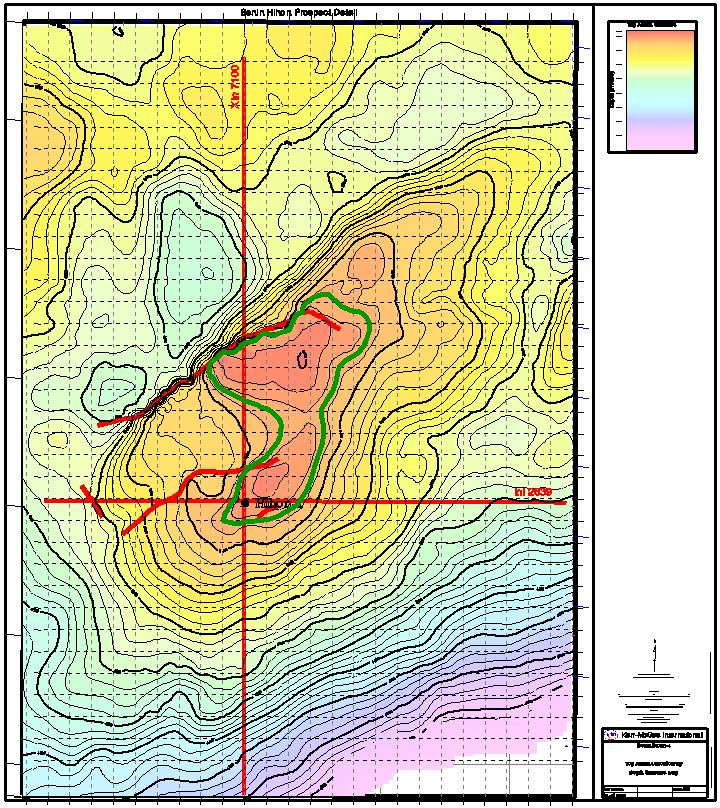
Figure 14: Some types of traps
Figure 15: Depth map showing the roof of a tank
- Geological risk assessment
Geological hazard assessment is used to determine the probability of success of exploratory drilling on a mapped prospect. The assessment of the geological chances of success associated with a prospect is done by assigning probabilities to the key geological factors that are essential to the formation and preservation of an oil or natural gas accumulation.
Thus, the determination of the geological risk of a prospect makes it possible to calculate the probability of success of this prospect. It is determined by the formula:
P(prospect) = P(source rock) x P(reservoir) x P(trap)
Waterproof trap + waterproof cover
Porosity and permeability of reservoir rock
Geological hazards
Maturity of the bedrock and therefore its degree of migration to the reservoir
(iv) Volumetric assessment of hydrocarbon resources
The evaluation of the hydrocarbon resources contained in the prospect consists of estimating the volume of oil or natural gas that could be found in the prospect. It is carried out using the geological and petrophysical parameters of the reservoir rock. This assessment is more accurate when using the results of the work carried out, in particular the results of exploratory drilling. Failing this, the parameters from the seismic interpretation or from the wells adjacent to the research area are used.
Thus, the quantity of hydrocarbons (VHcP) in place, i.e. oil (STOIIP) or gas (GIIP) in place, is determined as follows:
VHcP = GRV x N/G x Ø x Shc x 1/FVF
With
IBC = Gross Rock Volume: it is determined by taking into account the geometric shape of the reservoir and its thickness
IBCs = ∑Deposit Area x Deposit Thickness
N/G: This is the ratio between the net thickness of the tank and the gross thickness of the tank. It should be noted that the thickness of the deposit does not often have a uniform lithology. It is often interspersed with layers of impermeable clay.
Ø (Phi) = Reservoir porosity which is estimated from electrical logs, core measurements and knowledge from similar formations. It is determined as follows:
Porosity (Ø) = Pore Volume (Vv)/ Reservoir Volume (V)
Shc = Hydrocarbon saturation determined by knowing the water saturation Sw. It is usually calculated from the well digraphies in the effective porosity zone.
Shc = 1-Sw
FVF: This is the Volumetric Factor of Formation. It expresses the change in the volume of the oil from the tank to the surface under standard pressure and temperature conditions (pressure: 1 atm and temperature: 15° Celsius). FVF of the oil is Bo and for the gas is Bg.
FVF = Reservoir Volume/Surface Volume
- For the oil
FVF = Bo and Shc = So (oil saturation)
Thus,
STIIOP = GRV x N/G x Ø x So x 1/Bo
Associated gas in place = STOIIP x GOR
- For gas
FVF = Bg and Shc = Sg (Gas Saturation)
Thus,
GIIP = GRV x N/G x Ø x Sg x 1/Bg
Condensate in place = GIIP x CGR
with:
GOR: called Gas-Oil Ratio is the ratio of gas volume to oil produced
CGR: called Condensate-Gas Ratio is the ratio of condensate volume to the volume of gas produced
A lead ranking is performed when multiple leads are mapped on a contracted block. This classification is based on geological hazards (probability of success), the volume and type of hydrocarbons potentially in place, and other petrophysical parameters. The choice of the prospect(s) to be drilled takes this ranking into account in order to maximize the chances of success.
Once a discovery is made, the ICC carries out the work to evaluate the deposit. This work includes a set of activities, namely the drilling of appraisal or delineation wells, geological and geophysical studies of reservoirs as well as an evaluation of reserves to decide on the development of the deposit when it is commercially exploitable.
- Financing of exploration activities
Exploration activities are almost entirely funded by the IPCs as states lack the financial resources, technology, human skills and operational capacity to engage in this high-risk project.
Oil exploration is the most delicate phase with high risk in the sense that it involves heavy capital investments (CAPEX) for results whose probability of success is generally below the global average. Despite technological advances in oil exploration, the failure rate is high. About 2/3 of the exploration wells are dry. In the absence of commercial discovery during the exploration period, the CPIs lose all their investments.
- Responsibilities of States in the exploration phase
During this phase, the host country, although it does not often take financial risks, has a great responsibility vis-à-vis the contracting CPIs who assume virtually all the risks associated with the investment capital.
The two most essential roles of the State, owner of potential resources, are: the establishment of an oil database and the monitoring and technical and financial control of all activities carried out by the contractor.
- Oil Data Management
The host country must ensure the collection and preservation of all oil data acquired during this phase. These oil data constitute a decisive basis for future investigations. They have significant scientific and economic value in the sense that they provide information on the geology and resource potential in the subsoil of states.
This data concerns those produced during the exploration phase but also those generated during the development, production and abandonment phases. Some countries, due to a lack of means of conservation, i.e. technical and infrastructural capacity, entrust the storage and management of their data to partners or specialized foreign companies outside their territory. In doing so, they behave like landlords who entrust the key to their safe to their tenants.
“By entrusting the management of oil data to specialized foreign companies, states no longer have enough control over the various manipulations and businesses to which they are subjected. As they do not have control and management tools, they are unaware of the quantity and quality of their data, and consequently the economic value of their assets”.
They are therefore required to believe in the balance sheets and evaluations as well as in the decisions and choices of oil companies in the context of the implementation of oil operations.
This is why it is necessary for States to create adequate storage and conservation centers as well as laboratories for quality control and analysis of acquired oil data, which, in the same way as oil resources, constitute State assets. To this end, it is essential for States to adopt a real policy for the control and management of their oil data. Some West African countries are aware of this and are developing a good data conservation, analysis and management strategy. Côte d’Ivoire and Nigeria are a good example of the establishment of a centre for adequate storage and preservation and data analysis (Figure 16).
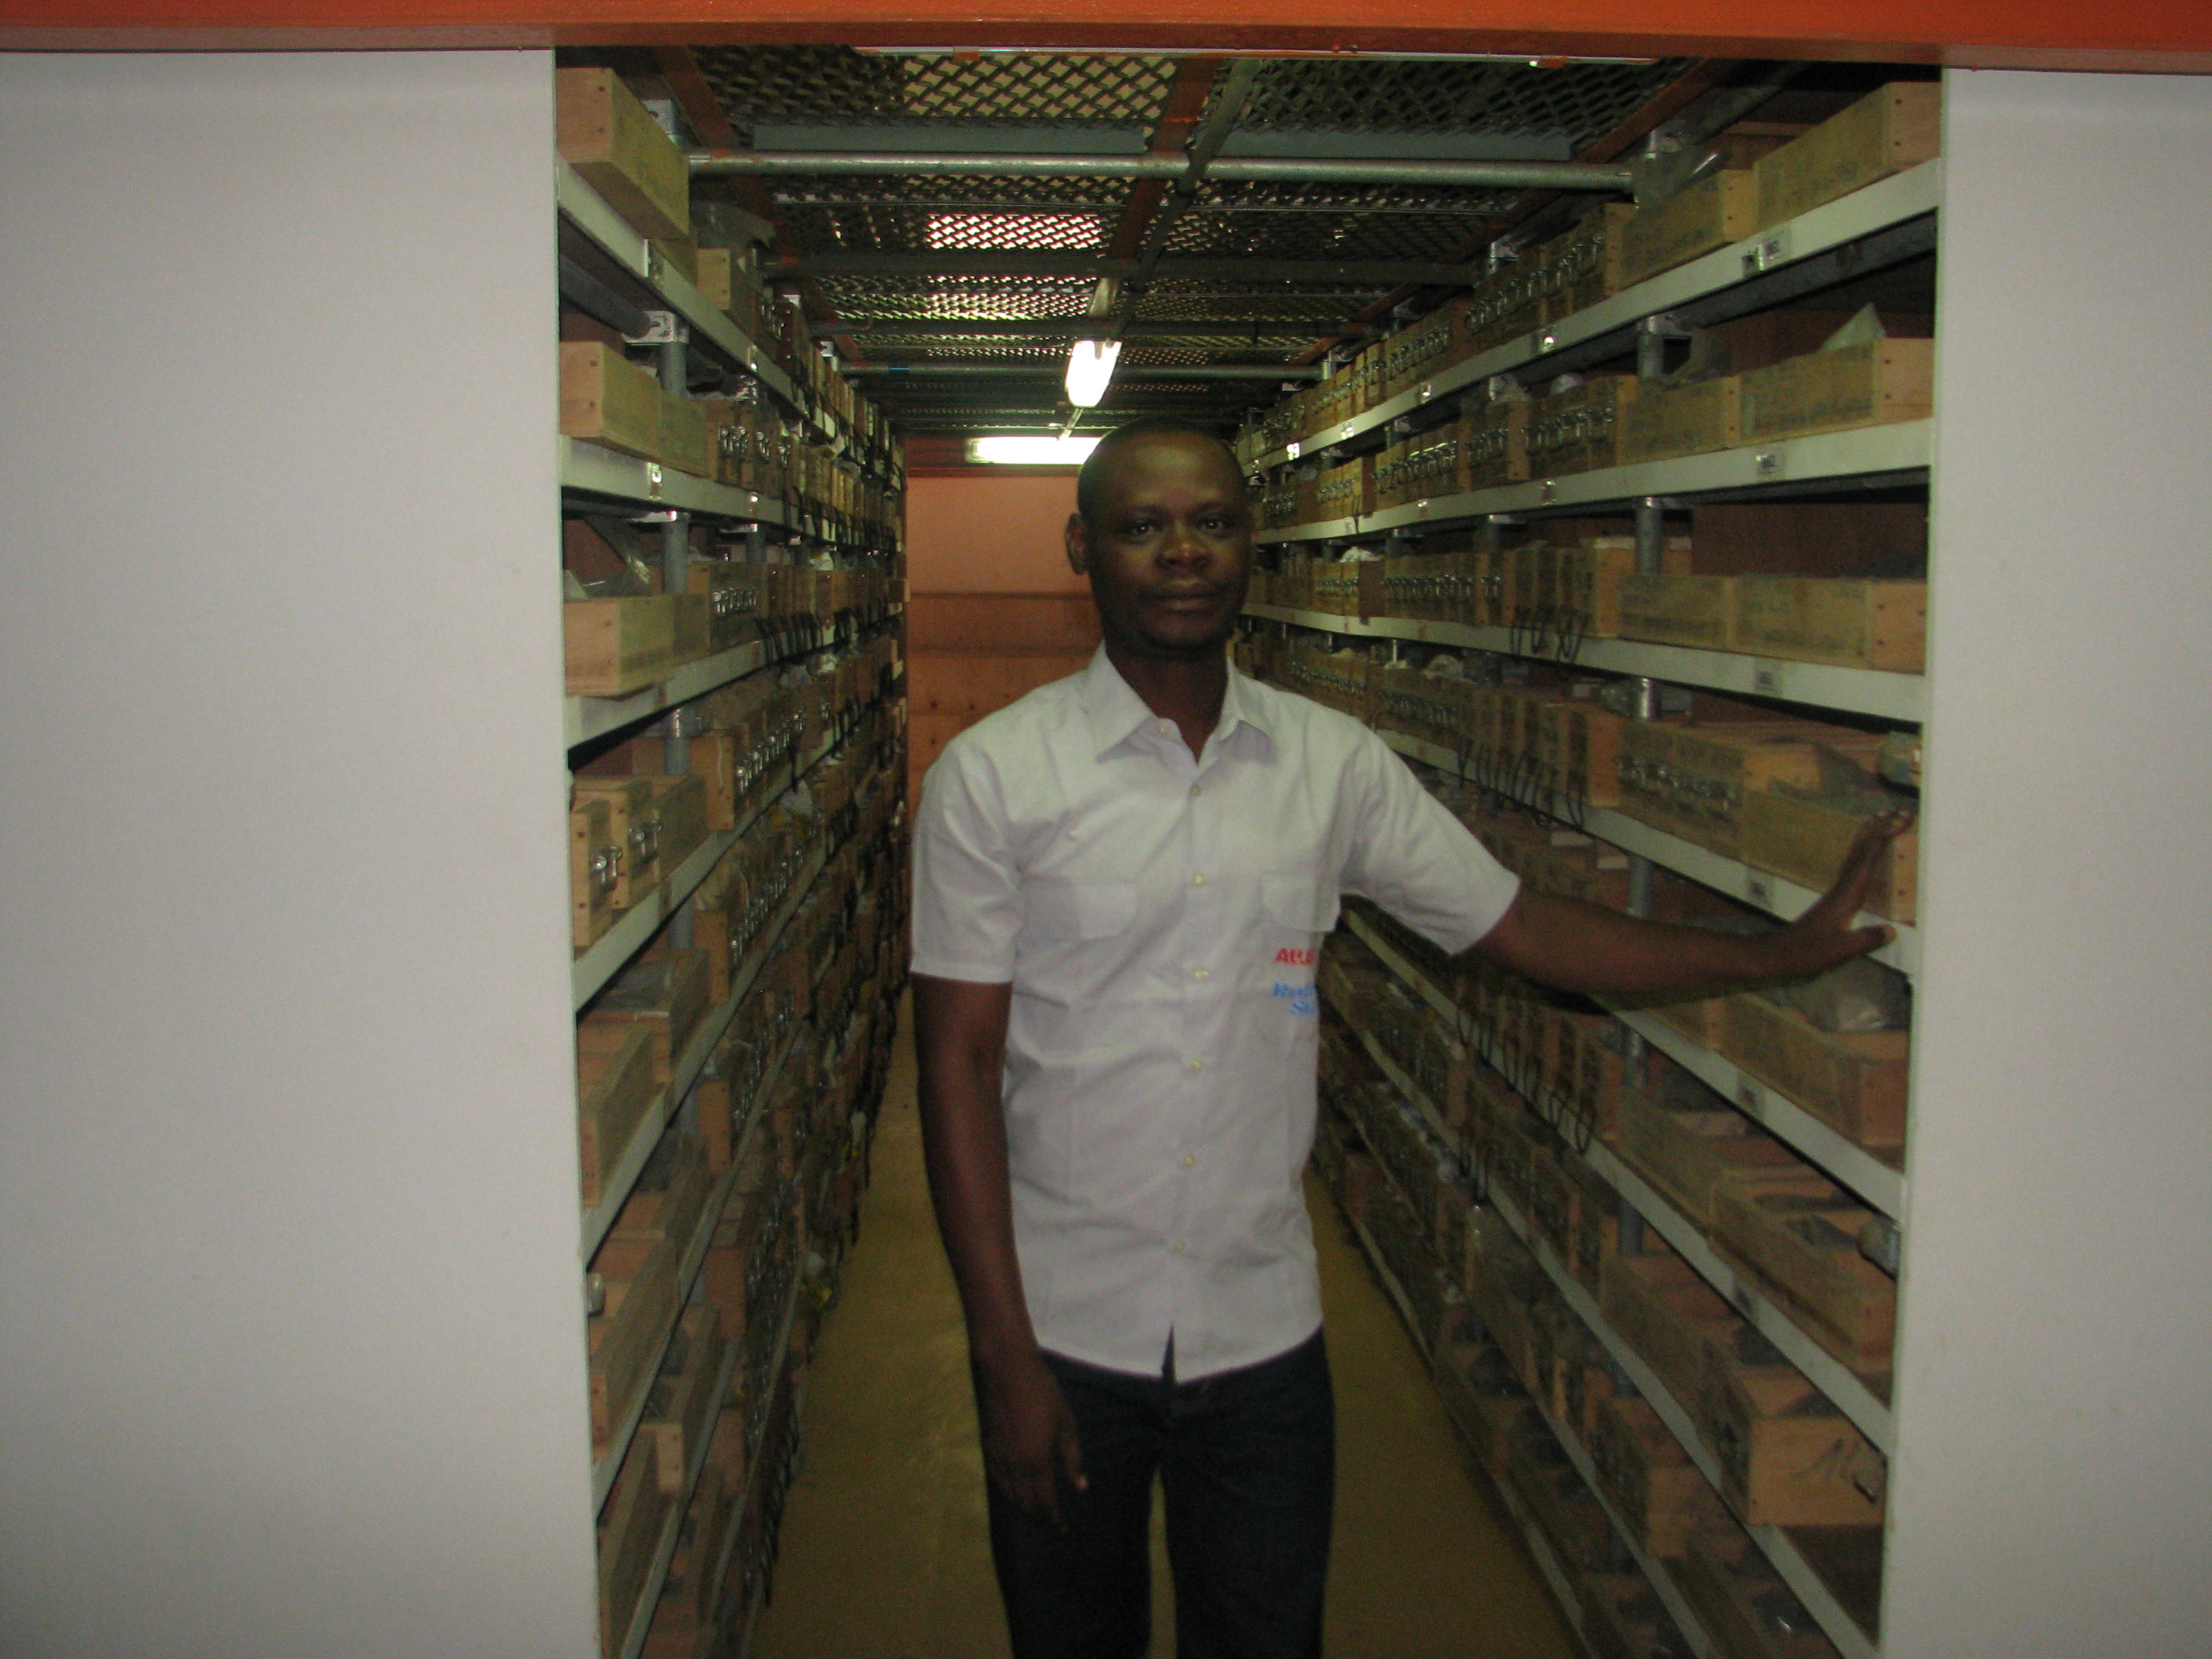
Figure 16: Photos showing the core library of Côte d’Ivoire at the Direction of the PETROCI Analysis and Research Center

- Monitoring and control of activities
The regulation of exploration activities includes not only the monitoring of the implementation of contractual obligations but also the control of the costs of carrying out activities as well as compliance with standards and procedures for the execution of activities in accordance with national regulations or those of the international oil industry. The monitoring and technical control of activities are fundamental sovereign functions of the State that require the existence of qualified human resources and the implementation of effective control tools for oil and exploration operations, including the management of environmental risks and impacts related to the implementation of these activities. This monitoring must be regular and well planned insofar as it is at this level that the contractor, driven by the search for maximum profit, could take advantage of the failure of the State’s control and audit mechanism to overestimate exploration costs or even deviate from the best practices of environmental protection during the implementation of activities.
In short, it is the responsibility of the States to monitor the effectiveness of the implementation of the activities reported, the optimal deadlines for completion, the quality of the work carried out at the technical level and in compliance with the environmental standards accepted or prescribed by the regulations and to audit the actual costs of their implementation through the development of a directory of the costs of the activities. This directory will have to be updated to serve as a reference for confrontations and audits.
- Development Phase
2.3.1- Definition and strategies
The development of an oil field consists of carrying out operations that contribute to the establishment of the production infrastructure of the discovered field(s). These typically include production platforms, production drilling, and infrastructure for storing and transporting crude oil or natural gas from the wellhead to the point of delivery, and onshore or offshore effluent collection and treatment facilities. During this phase, geological assessment studies, reservoir evaluation, feasibility studies and FEED (Front and End Engineering Design) studies are carried out in order to choose the best development option from a technical, economic and social point of view. All these studies contribute to the elaboration of a Development and Operation Plan (PDO) which is a clear document that describes the feasibility of the development project in its various well-planned aspects.
The PDP includes:
-
Geological assessment
-
Reservoir evaluation and reservoir technology including secondary and tertiary recovery study
-
Production and Drilling Technology
-
Facilities
-
Equipment maintenance
-
Economic evaluation
-
Safety and Environment
-
Project organization and execution
-
Abandonment plan
From discovery to production, it takes an average of three to four years for the development of an oil field. This means that this phase is very delicate in the sense that the optimal exploitation of a deposit depends on the development model chosen.
The choice of a development model depends on several technical and economic parameters, including the existing facilities or those to be set up, the nature or type of the reservoir (single or multilayered) and the thickness of the reservoir, the location of the reservoir (onshore, deep or shallow offshore), the quality of the reservoir, the quality of the crude oil and its market price, etc.
2.3.2- Reservoir Evaluation Methodology
The reservoir assessment is carried out according to the methodology shown in Figure 17 below. This methodology starts from data collection to the economic evaluation of the deposit. It allows, after processing, interpretation of the data, i) to carry out the modelling/simulation of the reservoir on the basis of the data available on the reservoir, i.e. seismic data, well logs, cores, well tests, ii) to determine the performance of the reservoir and iii) to project the most optimal and responsible production profile as well as the economic profitability of the development project with a view to decision-making of the deposit.
Geological and reservoir simulation studies provide detailed models of underground reservoirs to predict their behavior over time through the calculation of fluid flow fluxes that are a function of reservoir properties and well conditions (Figure 17). Simulation is therefore an essential decision-making tool that allows:
-
optimize production through i) a better understanding of the most efficient means of hydrocarbon recovery, i.e. the different recovery methods adapted to the characteristics of the reservoir (reservoir with active aquifer, reservoir with cap gas, the lithological nature and thickness of the reservoir, etc.), ii) the number and types of wells (vertical, inclined or horizontal) adapted to the reservoir in order to maintain its performance ;
-
manage risks by assessing and mitigating risks associated with drilling and production
-
to make an economic planning or forecast to help in an investment decision.
Excavated material, cores, seismic data, logging, well tests, etc.
RAW DATA COLLECTION
Descriptive elements of the reservoir (porosity, permeability, water saturation, pressure, oil viscosity, etc.)
PROCESSING AND INTERPRETATION OF THE DATA COLLECTED
INTEGRATION AND
MODELING
Tank Models and Understanding of the Tank
EVALUATION DES OPTIONS DE RECUPERATION
-
Recovery Methods (Primary, Secondary, and Tertiary)
-
Types/types of wells (production, injection and observation/horizontal, vertical, inclined, etc.)
-
Etc
Tank Performance Prediction
CAPEX, OPEX, Risk
ECONOMIC EVALUATION AND DECISIONS
Figure 17: Methodology Tank Evaluation
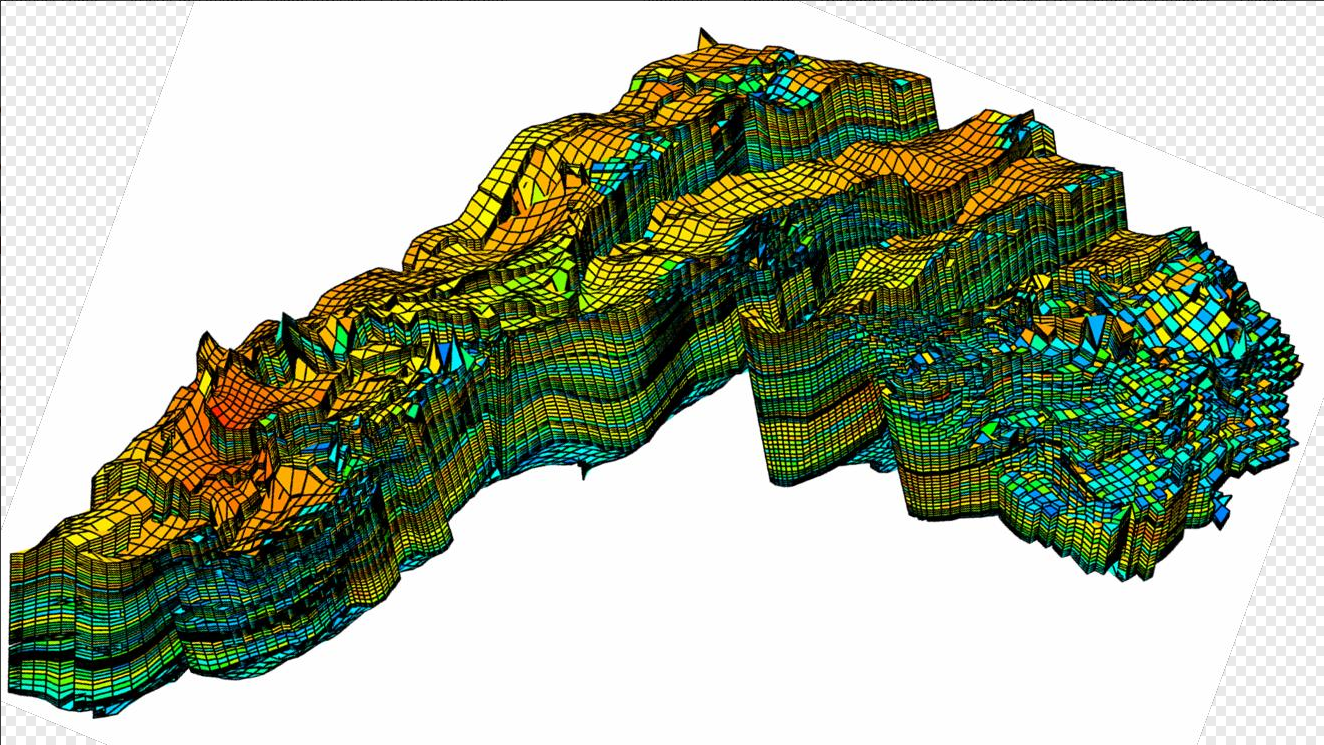
Figure 18: Diagram showing a reservoir model (Vilgeir Dalen, StatoilHydro, 2007)
2.3.3- Financing of development activities
Development involves large capital expenditures (CAPEX) in the upstream oil subsector. Enormous financial resources are invested in the production of hydrocarbon deposits. It should be noted, however, that the risk is lower during this phase compared to the exploration phase; The question that arises is no longer the doubt about the existence of the deposit, but it is above all that linked to the benefit/cost ratio of investments, which is a function of the technical and economic parameters and conditions related to its exploitation. This is why, before embarking on development operations, several preliminary profitability studies are carried out and recorded in the PDO submitted to the State for approval.
2.3.4- Roles and responsibilities of States in the development phase and Relevance of a PDO
The development of an oil field is subject to the approval by the Government of a Development and Operation Plan (PDO) or a feasibility study drawn up by the contractor and submitted to the State. The PDP preparation and approval process provides opportunities for dialogue between the contracting company and the host state on how the field should be developed and produced in a sustainable manner so that both parties can benefit the most. Thus, before the approval of the PDO, the State must proceed:
- The geoscience assessment of the PDP , which aims to:
-
Ensure that the quality of the reservoir interpretation is convincing enough for a development decision
-
Agree with the ICC on the PDP’s findings before it is approved
To this end, it is recommended that States:
-
Conduct in-house studies and interpretations based on well data, seismic data including 3D and VSP, maps etc.
-
certify the assessment of recoverable reserves and the feasibility study by its specialists or a third party
-
to organise meetings and dialogues with the operating company on the basis of the results of the counter-expertise work carried out by the State for fruitful technical exchanges
- The evaluation of the reservoir which aims to**:**
-
Ensure an optimal production strategy selection
-
Define the use of gas in an oil field
-
Ensuring the possibility of oil recovery in a gas field
-
define and guarantee the implementation of a serious and responsible production profile
-
Ensure proper management of the tank
-
Ensure consistency (correlation) between geology, reservoir and production strategy.
In short, the State, as the owner of resources, must:
-
avoid the hasty start of hydrocarbon development operations. Any start of the development plan must require the approval of the State after examination of all the preliminary studies and documents required by the petroleum legislation, including the reservoir simulations.
-
assess the economic development model that takes into account economic risks and uncertainties (price of a barrel on the international market), the duration and rate of depreciation or the oil cost recovery model, the production profile and by extension the duration of production. The business model proposed in the PDO or feasibility study must also have a positive positive return on investment
-
ensure that the PDP incorporates the requirements for abandonment of the field at the end of production. These requirements relate to the plugging of wells and the decommissioning of facilities to avoid safety and environmental damage.
This is why States must examine the results of the evaluation and simulation of the reservoir and the economic model developed or carried out by the operators (CPI) in order to better exchange on the uncertainties in order to adjust or build a new consensual production model if necessary.
In view of all the above, it is necessary for States to have a centre for the interpretation of seismic data, modelling, evaluation and simulation of the reservoir with qualified personnel to carry out a second assessment of the results of the reserve assessment studies, the development plan or the feasibility study proposed by the CPIs or, failing that, to have these studies certified by a third party.
The rigorous monitoring of activities during development is as important as during the exploration phase and requires vigilance, professionalism and probity on the part of the actors in charge of monitoring activities to avoid being duped or corrupted by the CPI who can manipulate the costs of operations for their own benefit; which will lower the margin of the profit to be shared.
“The hasty start of development operations for political propaganda reasons is often at the origin of immature development options that are sometimes unsuitable from a technical and operational point of view. This is at the origin of the technical difficulties during the operational implementation of the PDO. These difficulties very often lead to unnecessary loss of time, causing an increase in investments and poor control and management of the reservoirs, thus jeopardizing their performance in the short and medium term.”
“The development and production of the Sèmè oil field (Republic of Benin), discovered in 1968, is a good example of an ill-prepared oil adventure. Production started in 1982 by the Norwegian company SAGA Petroleum, with an immature feasibility study (weakness of the reservoir study, non-optimal development plan, inconsequential economic profitability study that does not take into account all the above-mentioned parameters, not taking into account an abandonment plan). After only a few years of production, precisely in 1985, with seven wells in production, the field was already experiencing a meteoric rise in water to the detriment of oil. Later in 1997, the situation was more alarming with about 90% water in most wells in production. The tanks were damaged. This is probably due to the weakness of the feasibility study, particularly in terms of the reservoir evaluation and simulation studies (number of wells put into production and the distance between wells because this field has a very active aquifer), the lack of professionalism of the operating companies and political considerations. The field was closed in 1998 after a change of hands with several operators for production (Saga Petroleum, PANOCO, PPS, ASHLAND, Atlantic Petroleum Inc,), under deplorable and inappropriate economic, financial, social and environmental conditions (high debts, dismissal of staff with unsatisfactory accompanying measures, failure to plug wells or secure offshore infrastructure, which today constitute a major environmental and security risk).
The redevelopment operations of the Sèmè field started in 2014 by the Nigerian company SAPETRO, which signed a production sharing contract on block 1 in 2004, also ended in failure due to the inadequacy and immaturity of the proposed development model, which led to heavy capital investments (construction of an oil platform, onshore processing and storage units with flowlines as well as new mooring buoys for export), and studies of the economic sensitivity of the project. The installation of this equipment and production units constitutes a heavy investment for residual reserves to be produced.
The economic model developed by SAPETRO was based on a barrel price of crude oil estimated at at least $80. Unfortunately, in 2015, the oil counter-shock of 2014-2016 which caused a fall in the price of a barrel of Brent from $110 to $36, between the beginning of July 2014 and January 2016, combined with the failures of two wells out of the three started due to the technical difficulties encountered during drilling, led to the abandonment of the SAPETRO redevelopment project which could not produce a single drop of oil and in turn put an end to Benin’s dream of becoming a producing country again in 2015“.
- Phase de Production
2.4.1- Definition and characteristics
This is the phase most awaited by the parties, namely the State and the contractor. Good tank management is always related to the technology used. It makes it possible to optimize production, in this case recoverable reserves. This is a very serious exercise that requires rigorous monitoring of production and periodic evaluation of the tank.
The minimum service life of the production facilities is 30 years. The maintenance of the installations is essential in order to prevent accidents, pollution and production interruption.
The life cycle of a hydrocarbon field put into production presents the different phases as shown in Figure 19 below.
Figure 19: Production profile of an oil field showing the life cycle of an oil field
The production profile adopted is an indicator of the duration of production or the life of the field. This profile is generally subdivided into three periods:
-
The build-up period or preparatory period during which the production wells are gradually brought into production. During this phase, there is a gradual increase in production over time to a maximum limit
-
The period of the plateau during which a constant production rate is maintained
-
The period of decline when producing wells show a decline in production throughput
Thus, the production time depends on the build-up phase, the plateau which can have a high, moderate or low production rate, but also the decline phase which can be mild or abrupt.
During the decline phase, new peak production phases (secondary or tertiary build-up) are often initiated by the use of secondary and tertiary recovery methods depending on the geological and geometric characteristics of the reservoir, the properties of the fluid and the petrophysical parameters of the reservoir.
2.4.2- Recovery methods and strategies
In oil production, it is impossible to fully recover the quantity of hydrocarbons initially in place from the reservoir. The recovery factor represents the amount of oil that can be extracted from a reservoir relative to the total amount of oil present in the subsoil. For optimal production of existing reserves, it is necessary to apply and choose the best techniques and recovery methods with regard to the properties of the reservoir and the development objectives. Thus, we distinguish:
-
Primary oil recovery describes the production of hydrocarbons under the natural entrainment mechanisms present in the reservoir without the additional aid of injected fluids such as gas or water. This recovery induces the loss of pressure in the reservoir due to natural production or production activated by a pump. The primary recovery factor for oil is typically between 15 and 20 per cent of in-place reserves.
-
Secondary recovery occurs when the reservoir pressure becomes insufficient to drain the oil from the reservoir to the surface or to cause natural recovery of the hydrocarbons. It consists of supporting the reservoir’s pressure by injecting water or immiscible gas into the reservoir to move the oil and lead it to a production well. When the oil field does not have a gas cap, it is recommended to inject water to improve the performance of the reservoir. Recovery can be improved by 15 to 45% in addition. Secondary oil recovery is a mechanical or physical operation that does not include chemical compounds or reactions (Jianjie Niu, Qi Liu, Jing Lv, Bo Peng, 2020).
-
As for tertiary recovery, it uses the injection of miscible gas such as as as thermal, chemical and biological methods. The objective of tertiary recovery is to modify the physicochemical characteristics of the oil to promote its flow. This method makes it possible to recover another 5 to 10% of oil. Tertiary recovery techniques are extremely expensive and are only undertaken when the price of a barrel of crude oil is high enough to justify the related investments.
In total, the oil recovery rate varies from 35 to 75% depending on the parameters influencing the recovery. The price of gas is better and is generally more than 75%, as gas is less dense, more mobile and therefore easier to reach the surface than oil.
The factors influencing recoveries are of several kinds:
-
Reservoir properties: The porosity, permeability and saturation of the reservoir determine the amount of oil that can be recovered. High porosity and permeability help extract more oil from the tank, while low porosity and permeability make the extraction process difficult.
-
Oil Properties: The viscosity, density, and API density of the oil determine the efficiency of the extraction process. High viscosity oil is difficult to extract, while low viscosity oil is easier to extract. Similarly, the density of the oil affects the recovery process. Heavy oil is more difficult to extract than light oil.
-
Recovery techniques: Artificial lifting techniques such as beam pumps, gas struts, and electric submersible pumps can increase the amount of oil recovered from the tank. The choice of recovery technique depends on the properties of the reservoir and the properties of the oil.
-
Production rate: the application of a very high production rate can lead to a decrease in the tank pressure, and damage the tank as quickly as possible; which can reduce the amount of oil recovered.
-
Tank pressure: The pressure in the tank decreases as oil is extracted, which can reduce the amount of oil recovered. Using artificial lifting techniques during primary recovery can help maintain tank pressure, resulting in increased oil recovery.
2.4.3- Financing of production operations
Investments during this phase are lower than in the previous phase and are referred to as “operating costs (OPEX)”. These costs are easily financed by stakeholders because of the revenues that are generated from production. They relate to the costs of maintaining the installations and reconditioning the wells (workover work) and sometimes to expenses related to improving the performance of the reservoir through geological and reservoir studies.
2.4.4- Responsibilities of the Host States in the production phase
As in the development phase, the vigilance of the states that own the resources is required in order to avoid false declarations of production. This vigilance requires adequate training in the monitoring and inspection of production and transport activities as well as the control of equipment and measurement parameters agreed upon or accepted in the oil industry.
Indeed, from the wellhead to the point of delivery, the hydrocarbons produced can be subject to unhealthy handling by the CPIs whose objective is to maximize their profits. They can truncate the quantities of hydrocarbons produced so as to set up a mechanism for false declarations if the method of monitoring and inspecting oil operations is not effective at the state level. This is why controls and inspections of equipment and installations built on site or imported for the storage and transport of hydrocarbons are recommended to determine the compliance of the condition of the installations with the necessary international requirements and to ensure that measurements of the physico-chemical parameters of hydrocarbons or counts are made a certain number of times along the path of products from the wellhead to the point of delivery to ensure reliable results. The purpose of these measurements/counts is to determine, among other things, the quantity and quality of the production, transport and sales chain.
Tax metering is the measurement carried out in the context of the purchase and sale of crude oil or natural gas and the calculation of taxes (e.g. CO2 tax, NOx tax) and royalties.
In addition, it is important to emphasize that the volume of crude oil depends on the temperature. A change in temperature causes a change in the volume of crude oil. Indeed, crude oil contracts in the cold and expands when the temperature increases. In other words, for a quantity of crude oil produced whose volume is measured at 120°C at the wellhead, the same volume measured at 15°C at the point of delivery is less than that measured at 120°C.
By way of illustration, a manipulation or measurement error of 0.4%, for example at the measurement point to the detriment of the producing States, would generate significant financial losses as shown in Table 4 below for these countries and an equivalent gain for the contracting company:
| Country | Daily production (bl/d) | Measurement/Counting Error (%) | Price per barrel ($US) | Financial loss ($US) | |
|---|---|---|---|---|---|
| daily | annual | ||||
| Niger | 53 000 | 0,4 | 90 | 19 080 | 6 964 200 |
| Ivory Coast | 74 000 | 0,4 | 90 | 26 640 | 9 723 600 |
| Ghana | 188 000 | 0,4 | 90 | 67 680 | 24 703 200 |
| Nigeria | 1 539 000 | 0,4 | 90 | 554 040 | 202 224 600 |
This means that a margin of error greater than the tolerance threshold allowed in the oil industry generates losses for one or the other of the parties. Margins of error are usually due to improper calibration or calibration of the measurement and metering system during the transfer of hydrocarbons, failure or conscious or unconscious manipulation of the measuring instruments and conditions.
Unfortunately, African States pay very little attention to these aspects and may be victims of false declarations by the ICCs due to the absence or inadequacy of monitoring of activities and/or the weak technical competence of the inspectors in charge of monitoring and monitoring activities.
“It is unfortunate to note that some senior officials and leaders of certain producing countries of sub-Saharan Africa, congratulate CPIs for the realization of some flattering socio-community works (construction of boulevards, schools, markets…) in their country, forgetting the regulatory and inspection roles that are their prerogatives and whose full exercise will considerably reduce the shortfalls for their State and consequently have a positive and better impact on the development of their nation.
In many respects, Corporate Social Responsibility (CSR), which is advocated and introduced in certain extractive industry contracts and projects, and which should be a springboard for socio-community development and for better environmental management in the geo-extractive industries, is akin to a form of contemporary neo-colonialism where the CPIs, representing Western powers, seek to please themselves in order to better establish their domination and hegemony and in this case for the plundering of resources“.
“Let’s not forget that the CPIs are not philanthropists; Their main objective is to make the maximum profit in record time.”
This is why it is essential that African countries, especially those in sub-Saharan Africa, take their responsibility and effectively play their regulatory role. As such, they must work more to:
-
mastery of the operating principles of the devices and approval of measurement procedures,
-
periodic or regular inspections of equipment, apparatus, parameters and procedures jointly accepted and in accordance with the use in the international petroleum industry, and finally
-
the training of adequate skills in the field of control and inspection in the upstream oil sector in order to ensure that the performance of operations is carried out in accordance with the rules of the art and in transparency.
Abandonment
2.5.1- Definition of the concept
The abandonment or closure of a field occurs when the recoverable reserves are exhausted or when the installations have reached their useful life. This means that the project has reached its economic profitability limit.
Any PDO must contain a plan for the abandonment and decommissioning of petroleum facilities used in the development and production of hydrocarbons.
Thus, decommissioning is a process that sanctions the end of the life cycle of an oil or gas field and makes it possible to decide or make the choice of the best option to put oil and gas facilities out of harm’s way from a safe and environmental point of view. To this end, it consists of:
-
plugging wells (production, injection and/or observation wells);
-
cleaning of all pipelines, reservoirs or hydrocarbon storage and processing tanks;
-
securing the facilities;
-
the total or partial removal of equipment or facilities installed for the operation;
-
the reuse of the installations or their disposal under suitable conditions and arrangements.
The implementation of the abandonment plan must take into account international regulations and legislation in the countries concerned. Such legislation generally takes into account the needs of environmental protection, safety of navigation, fishing activities and other uses of the marine environment.
2.5.2- Financing of decommissioning/abandonment work
The responsibility for financing the abandonment work lies with the owner of the equipment and installations defined according to the type of contract signed. For example, in the case of a Production Sharing Contract, the costs of the abandonment work (ABEX) are generally financed from the provisions put in place during the production phase, in accordance with the contractual provisions. In most legislation and Production Sharing Contracts, the host state authorizes the CPIs to use this provision to carry out abandonment or decommissioning work at the closure of the oil and gas field.
2.5.3- Responsibilities of States in the phase of abandonment
The role of the State is to ensure that a decommissioning/abandonment plan has been drawn up and integrated into the PDO or in the feasibility study of the development submitted by the contractor. This elaborate plan can be updated or adjusted according to changes in the technology used during development and production. The decision to approve the decommissioning plan by the State, which defines the best technical solution, must take into account safety, environmental and economic criteria, in particular the cost of decommissioning, etc. The State, in its decision, must set the maximum duration of the decommissioning on the basis of the contractor’s recommendations.
- Summary of expenses and revenues during the life cycle of an oil project
The summary of cash flows from pre-licensing to abandonment indicates the expenditures (investments) incurred in oil exploration and development activities and the revenues derived from production (Figure 20).
The financing of pre-licensing activities is generally a matter of state sovereignty and some activities may be carried out under a service contract. These activities are therefore part of the sovereign spending of States.
Once a contract is signed, the contractor undertakes at its own risk to make enormous capital expenditures (CAPEX) during the exploration and development phases.
During the production phase, the parties to the contract (State and contractor) generate income from the sale of the hydrocarbons produced. Investments (OPEX) relate to the maintenance costs of production equipment and facilities and are easier to mobilize by contract partners who use part of their production revenues. Cash flow is positive. The profits from the production are shared between the parties in accordance with the contractual provisions.
In the abandonment phase, the expenses related to the works (ABEX) are financed by a part of the income from production in accordance with the contractual provisions which generally provide for provisions for the execution of the abandonment works.
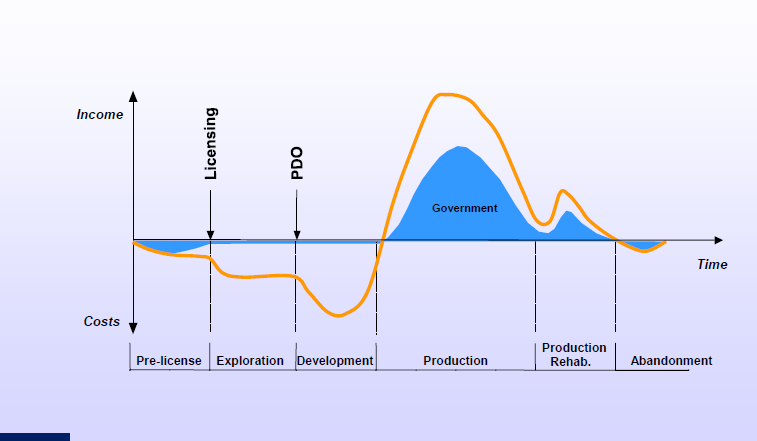
Figure 20: Cash flows during the different phases of upstream oil activities (Dr. Alfred Kjemperud, 2007)
Chapter 3: Tax Regimes in the Petroleum Sector
There are three main factors that define the economic value of a state’s oil resources (Figure 21). These are:
-
the exploitability, which is linked to the quantity of petroleum resources discovered and the geological and technical conditions necessary for their development;
-
market conditions that are defined by the price of crude oil on the international market; and
-
the tax regime, which is the regulatory framework developed by the State and which defines the tools for managing petroleum resources.
Figure 21: Economic Value of Hydrocarbon Resources
The economic income of an oil-producing state is the benefit that this state derives from the development of its oil resources (Figure 22). It is calculated by subtracting from the total monetary value of hydrocarbons in the subsoil, the various investments for its development, from exploration to abandonment, including exploitation, and the share of the profits accruing to the investor. For the State, which owns the resources, it is equivalent to the share or fraction that is due to it, and which is collected through a certain number of mechanisms, namely, bonuses, royalties, dividends from the direct participation of the State, its share of the oil profit and taxes.
The remaining oil after deduction of investment (profit), called oil profit, is shared between the government (state) and the contractor in accordance with the tax regime on the basis of which both parties have committed themselves through the oil contract.
The obvious and sometimes contradictory interests of the State and the Contractor (CPI) noted during the negotiation of contracts are linked to the degree of risk-taking by the parties.
Indeed, the CPIs that take huge amounts aim: i) the profitability of the project, ii) better profits for the shareholders and consequently iii) a large production at a high plateau in a relatively short period of time in order to recover their investments as quickly as possible, i.e. to have a quick return on investment. These are the financial risks linked to the heavy investments required for oil exploration, the political risks that can arise in the event of political instability (wars, change of political regime, etc.), the economic risks linked to the change in the tax regime and/or the drastic drop in the price of a barrel of oil on the international market, and geological and technical risks.
On the other hand, the State’s objective is to ensure from its oil resources: i) long-term benefits for its population, ii) employment, well-being, the transfer of skills and by extension iii) the exploitation of resources for the longest period of time with the highest possible recovery rate.
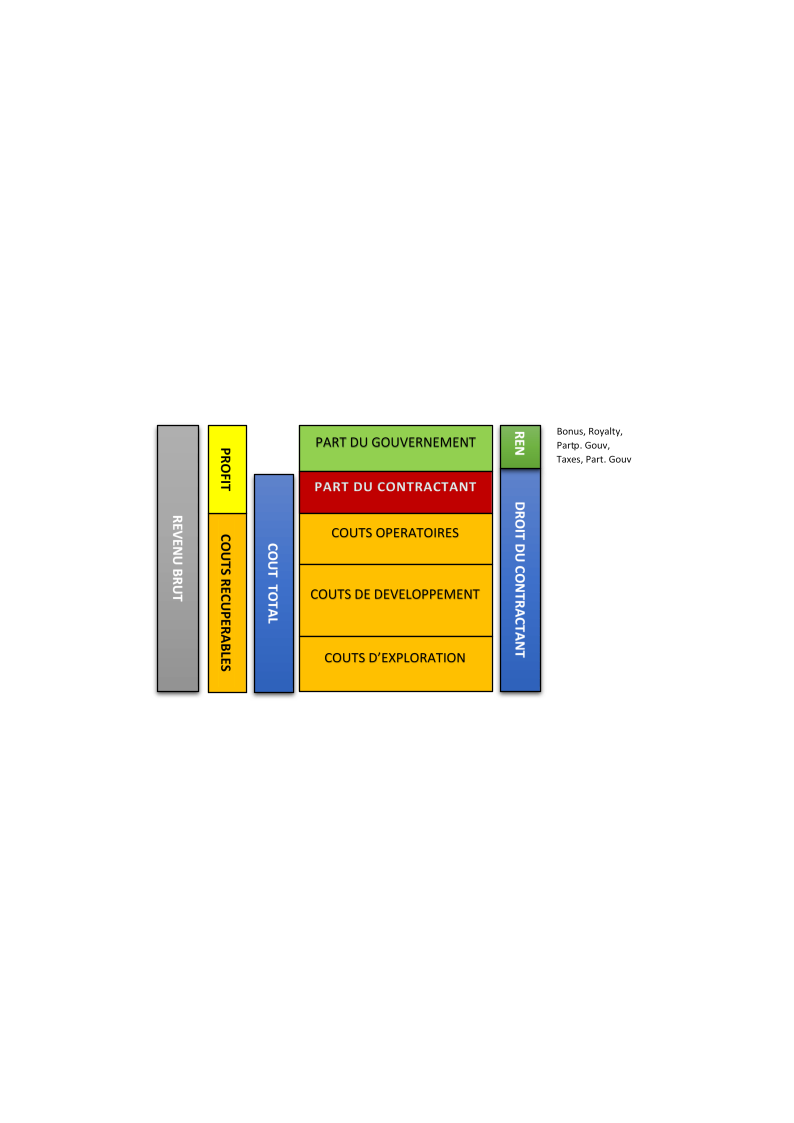
Figure 22: Distribution of income from production (After Johnson, 1995)
REVENUE BREAKDOWN
3.1- Tax system or system: Conceptual foundations
The tax system is the most important resource management tool for states. This is why it is mandatory for all managers and decision-makers in the oil sector to understand the basic principles, types, advantages and disadvantages of each tax regime.
The main objective of oil taxation is to capture economic rent, i.e. the surplus remaining after deduction of costs and a reasonable return on investment. Institutions such as the World Bank and the IMF generally insist that governments must secure a fair share of this rent, while leaving investors with sufficient earning potential to justify the risks involved.
Oil projects require significant investment and span the long term, often several decades. As a result, tax systems must take uncertainty into account. One of the key principles is progressivity: the state’s share must increase with profitability. This ensures the viability of projects in times of low prices, while allowing the government to benefit more when economic conditions improve.
At the same time, investors need stability. Sudden or unpredictable budget changes can undermine confidence and delay investment decisions.
Governments, on the other hand, need flexibility to adapt to changing economic conditions. Striking the right balance between stability and adaptability remains one of the key challenges in designing and adopting effective oil tax systems.
There are two families of tax systems in the oil industry, namely concession systems and contractual systems (Figure 23). The laws or regulations applied to oil exploration and exploitation in a country depend on the tax regime adopted by that country.
Figure 23: Classification of tax regimes
-
Argentina
-
Brazil
-
Venezuela
-
Philippines…
3.2- The concession system
The concession known as a license or lease is the oldest and most widely used of the tax regimes for petroleum agreements. This system is most often characterized by agreements based on Royalties and Taxes. This system has the following characteristics:
-
The oil company has the exclusive right to explore and produce at its own risk and expense;
-
The oil company owns the production;
-
The oil company pays the ad valorem royalty and the surface royalty to the State;
-
The oil company pays taxes on profits;
-
The oil company has the right to export hydrocarbons;
-
The oil company holds title to the equipment.
3.3- The contractual system:
In this system, there are two categories or types of contracts, namely the Production Sharing Contract (PPC) and the Service Contracts.
- The Production Sharing Contract (PPC)
The Production Sharing Contract ( PSC ) is the most commonly signed type of oil contract in Africa and is based fundamentally on three cardinal elements, namely: recoverable costs, oil profit sharing between the Government and the ICC and taxes on profits.
It was experimented with more the first time in Indonesia. In general or standard terms, a CPP contains provisions on the following elements:
-
Bonuses: these are signing, discovery or production bonuses. It is a lump sum paid under the conditions and within the time limit provided for by the regulations by the contractor, who holds an exploration or exploitation permit, but which is generally non-refundable, i.e. this amount paid is not included in the recoverable oil costs.
-
Work obligations: this provision defines the volume of work that will be carried out by the contractor during the contractual period. It is generally a question of quantifying the volume of 2D and/or 3D seismic and other Geological and Geophysical (G&G) studies to be carried out, the number and type of wells to be drilled with the related projected expenses
-
Royalties: these include:
-
the royalty, also known as the ad valorem royalty, which allows the states that own the resources to dispose of part of their resource before any sharing of oil and profit; and
-
surface royalties, which are rights to lease the block or perimeter under contract;
-
Cost oil: this section defines and clarifies the operations, activities or fees paid or spent by the contactor and which will be reimbursed in the event of discovery during the production phase in accordance with the terms and conditions set out in the CPP;
-
Profit-sharing of oil : in a CPP, the terms and conditions for sharing oil-profit between the parties (contracting party and State) must be known with previously defined distribution keys;
-
State participation: This is a share of action granted to the State and which is defined in the CPPs. The terms and conditions of the State’s participation as well as the rate of this participation in oil exploration and exploitation operations are specified in the contract. Generally, for many countries, the State’s participation is carried out in the exploration and development phase;
-
Domestic market obligations: the rules for selling hydrocarbons to the State at a preferential price solely for the satisfaction of the country’s needs must be defined in the CPP. It allows States to ensure their energy security through the exploitation of their resources. This obligation governs the export of petroleum resources by the ICCs, especially when the country’s domestic needs are not yet met.
-
The employment and training of local staff: this provision is very important to the point that it has now been extended to encourage the takeover of a certain number of activities by local staff and companies. The aim is to develop Local Content, a concept currently used to promote the establishment of local services and the development of national companies in the oil sector with a view to an efficient and operational transfer of technology and knowledge. In view of the importance of Local Content, some States have established it as a law or special regulation.
The essential characteristics of a PPC are:
-
the contractor shares the risks with the State;
-
the contracting party obtains a share of the production, generally in kind;
-
the State holds the title to the equipment;
-
the State retains its title to the oil. In other words, the contractor never holds title to the oil
- Service Contracts
Service contracts can be divided into pure service contracts and risky service contracts.
- Pure Service Contras
In this category of contracts, the state takes all the risks and hires an oil company to explore and produce oil discoveries for remuneration that is independent of or does not take into account the profit of the project. Such contracts exist in the Middle East but are rare in other parts of the world. It is this type of contract that Benin signed in 1979 with the Norwegian company SAGA Petroleum for the development of the Sèmè field. Similar arrangements are used by oil companies towards service companies such as PGS, Schlumberger and others.
- Risky Service Contract
Risky service contracts involve the oil company taking a risk and are the most commonly used service contracts.
In the case of this type of contract:
-
the contractor shares the risk with the State;
-
the contracting party receives a share of the profits, usually in cash;
-
The State holds title to the equipment and retains its title to the oil;
-
The contractor never holds title to the oil.
Risky service contracts are in many ways similar to production sharing contracts, except for the method of payment (cash or in-kind) and the same elements and mechanisms are used to regulate the relationship between the two parties in these two types of contracts.
- Structure of Oil Tax Systems in West Africa
Most tax systems in West Africa are based on a combination of instruments, each serving a specific function. Royalties generate quick revenues, but can be regressive, especially for marginal deposits. Cost-recovery mechanisms, particularly under production-sharing contracts, allow investors to recoup their expenses, although these mechanisms are usually capped to ensure that the government begins to collect oil profits within a reasonable period of time.
Taxes on profits, such as corporation tax or capital gains tax, are the main instruments for capturing economic rent and introducing progressivity. Premiums are initial payments, but generally contribute less significantly to overall revenues. State participation, most often through national oil companies, can strengthen public control and returns, but also exposes the State to financial and operational risks.
It is the interaction between these elements, rather than a single component, that determines the overall share of government and influences how investors assess risks and rewards.
- Contractual frameworks in West Africa
Production sharing contracts (PSCs) are the dominant model in West Africa. They allow governments to retain ownership of resources while relying on private companies to provide capital and technical expertise. Under a CPP, contractors assume the risks of exploration and development, recover their costs through production, and then share the remaining oil profits with the state.
Concession systems are still used in some states, particularly those influenced by Anglo-Saxon legal traditions or those with a more mature oil sector. Service contracts are less common, but exist in some special cases. In practice, many countries use hybrid approaches, combining elements of different systems to meet the specific needs of their projects or policy objectives.
Chapter 4: Comparative Study of Tax Regimes in Selected West African Countries
Case study of Benin, Niger, Ghana, Côte d’Ivoire, Nigeria and Senegal
4.1- Design principles of the flow diagram associated with the oil contract
Before the start of oil negotiations, the State, which owns the resources, must draw up a simplified financial or economic flow chart showing the distribution of revenues between the contractor and the State. This diagram constitutes a summary economic model that allows the State to know the oil rent that will accrue to it after exploitation. This flow chart is a decision-making tool that allows the States that own the resources to better assess their tax regime and the negotiable parameters on which they must act during contract negotiations to get the most out of their resources.
The legal and regulatory instruments on which States must base their design of this decision-making tool are the Petroleum Code and especially the tax regime.
Petroleum Code
It is the legal instrument that governs the exercise of oil operations. It provides, among other things, provisions that are likely to encourage companies or consortiums of oil companies to carry out oil operations, given the particularly high costs of research work, but also provides provisions that regulate the distribution of revenues between the State and the partners.
Tax regime
The tax regime is generally enshrined in the oil laws of the states. In Benin, for example, Law No. 2019-06 of 15 November 2019 on the Petroleum Code only enshrines the production sharing contract as the applicable tax regime for the carrying out of oil exploration and exploitation work by the CPIs. To this end, a model production sharing contract was adopted by decree in 2020. Other countries have in their legislation in addition to the Production Sharing Contract (PPC), other tax systems, namely the concession contract and service contracts. In Nigeria and Côte d’Ivoire, for example, their legislation authorises the signing of a CPP or a concession contract.
The cardinal elements of the tax regimes that make it possible to produce this simplified diagram which allocates the revenues of the State and the contractor are the ad valorem royalty, the cost oil, the profit oil, the corporation tax. In addition, the State participates in oil operations.
Tax elements such as bonuses and ad valorem royalties (royalties) that induce upstream payments to the State are not based on the profit of the project. They are set up to reduce the risks of states. On the other hand, these upstream payments to the State make the tax regime regressive when they are too high, and therefore unattractive to investors. The regressive system does not encourage the CPIs who prefer a progressive tax regime where the state rent is much more based on income taxes, additional taxes etc. resulting from the benefits of the project.
- Key tax elements applied in selected West African countries
4.2.1- Redevance ad valorem (royalty)
When the first drop of oil or gas comes out, a share is directly allocated to the state that owns the resources before any deduction of costs or any sharing of production. This share is called royalty. It is mainly applied in concession contracts. This royalty is introduced in the PSAs in anticipation of unforeseeable reservoir risks at certain hydrocarbon deposits. This fee, when it is too high in PSAs, can be the cause of early or premature cessation or abandonment of fields by the CPIs. It can be received in kind or in cash.
The balance obtained from the monetary value of oil extracted from the deposit (gross revenue) after deduction of royalty is the net royalty income. Gross income depends on the quantity of crude oil extracted from the deposit, the quality of the crude oil and the variation in the price of crude oil on the international market. Thus, we have:
Post Royalty Revenue = Gross Revenue – Royalty
Table 5 below shows the proportions of royalties adopted in the oil regulations of selected West African countries.
| ROYALTY (%) | Observations | ||||
|---|---|---|---|---|---|
| Oil | Natural gas | ||||
| COUNTRY | Offshore | Onshore | |||
| Shallow | Deep | ||||
| Ghana | 5 to 12 | 4 to 10 | |||
| Benin | 10 to 15 | 2.5 to 5 | |||
| Ivory Coast | - | Pas de royalty | |||
| Senegal | 9 | 8 | 10 | 6 | |
| Nigeria | 12,5 | 7,5 | 15 | 2.5 to 5 | |
| Niger | - | - | 15 | 2.5 to 5 | No offshore basin |
The analysis of this table shows that the royalty does not exceed 15% in most West African countries and varies according to:
-
The nature of the fluid: the royalty rate of oil is much higher than that of gas. The maximum in the countries studied is 15% for oil and 6% for gas. This difference may be linked to the recovery rate of gas, which is higher than that of oil;
-
The geological area of discovery: depending on whether it is onshore or offshore, shallow, deep or very deep. Royalties are lower in offshore geological areas that require more investment for hydrocarbon exploitation than in onshore;
-
the variation in the price of the barrel and on the volume of oil produced: in addition to the two groups of parameters mentioned below, other countries such as Nigeria for example, have introduced an additional royalty which is based on the variation in the price of the barrel and on the volume of oil produced. This royalty could be interpreted as an additional oil right allowing the capture by States of capital gains when the price of a barrel on the international market rises and reaches a given threshold, in order to increase their oil rent.
Côte d’Ivoire does not provide for a royalty in its PSA. This is likely to attract investors. In doing so, its PSA may seem more attractive than those of other countries in the West African sub-region in this area.
As for Benin, the royalty bracket in the offshore zone is less attractive than those of Ghana, Senegal, Côte d’Ivoire and Nigeria for oil but practically the same for natural gas.
4.2.2 - Recoverable Petroleum Costs
They concern exploratory costs, development costs and operating costs invested or set up by contractors for the conduct of oil operations, including depreciation/depreciation. Before the oil is profited, a portion of the production is allocated to recover the costs invested by the contractors. In oil contracts, a ceiling is set in the regulations of the tax regime. This cost recovery cap is called the Cost Stop. International oil companies want a quick recovery of their investments to minimize unexpected political risks that could cause a production blockade in some countries and unpredictable technical and reservoir risks that could lead to lower production yields sooner than expected. A cost stop and a high daily production rate allows the CPI to achieve the shortest possible payback period. This duration is defined by the time it takes for the initial investment related to exploration and development costs (CAPEX) to be recouped.
The graph below (Figure 24) shows the cost stop in the West African countries covered by our study.
Figure 24: Graph showing the cost stops applied in some West African countries
The analysis of this graph reveals that the setting of the cost stop varies from one country to another. The overall rate applied in these countries is between 55% and 80% and depends on the situation of the contractual area (onshore, shallow offshore, very deep or ultra-deep). The relatively higher cost stops are applied in areas of high bathymetry, i.e. deep to ultra-deep offshore, which present enormous challenges in terms of exploration technology and investment, in order to encourage companies to undertake operations in these areas of high financial and technical risk. On the other hand, for onshore and shallow offshore areas, states opt for a lower cost stop.
The comparative study of the Cost Stop shows that Benin and Côte d’Ivoire have a relatively more attractive cost stop. For Benin, it is capped as in the case of most countries and varies from 70% onshore to 80% very deep offshore. Côte d’Ivoire, for its part, has adopted in its regulations a cost oil of 60% in shallow offshore and 80% in very deep seas. Ghana, for its part, has opted in its legislation for a depreciation of capital expenditure (exploration and development costs) of 20% each year from the date of commercial production for a period of 5 years, i.e. a linear recovery of investment costs for 5 years. Ghana’s option allows the contractor and the State to operate an effective and efficient mode of production, in the sense that the annual amount to be reimbursed is not a function of production, so that the resources can be exploited responsibly and sustainably until the repayment of the capital expenditures recognized in the legislation.
4.2.3- Oil Profit
Oil profit is the share of oil that remains after the deduction of oil costs and the Royalty (ad valorem royalty) and is shared between the Government and the Contractor. Profit oil is analogous to taxable income in a concessional system. Oil profit is usually, but not always, taxed.
It is calculated by the following formula:
Oil Profit = Revenue Post Royalty – Recoverable Costs or
Oil Profit = Gross Revenue – Royalty – Recoverable Costs
In the Production Sharing Contracts of Benin and Niger, the share of the oil profit accruing to the contractor is no longer taxed.
The modalities of distribution of oil profit vary from one country to another. Some countries adopt a sharing mechanism based on daily or cumulative production on a progressive scale, while other countries opt for a sharing mechanism based on profitability (R-factor or rate of return), which is a function of oil revenues and costs. That is, maximum and minimum profit oil refers to contracts where there is a dynamic scale dependent on a trigger which can be the volume of production, economic factors like the internal rate of return or other criteria. If the sharing of profits is high in favor of the oil company, the States must secure their share by other measures, most often by taxation.
The R-factor can be used as a trigger for both royalty and profit sharing. It is determined in different ways:
-
R-Factor=Cumulative Revenue/Cumulative Cost
-
R-Factor = (Cumulative Revenue - Cumulative Opex) / Cumulative Capex
-
R-Factor = (Cumulative Revenues - Cumulative Profits) / (Cumulative Investments + Cumulative Opex)
-
R-Factor=Cumulative Net Revenue/Cumulative Costs
When the – R factor becomes larger and larger, it means that the profitability of the project becomes higher with a drastic decrease in recoverable costs. It is up to the States to define in their regulations the easiest method of calculation that allows them to capture the best shares of the oil profit more quickly. Thus, when all capital expenditure (CAPEX) is recovered by the contractor, the sharing key must be reversed so that the State’s share becomes higher and higher.
In addition, in order to avoid any manipulation and inflation of recoverable oil costs, it is essential that States rigorously monitor the costs invested, carry out annual audits and train their staff in cost control, since the calculation of the R-Factor is closely linked to the costs invested and consequently the mechanism for rewarding profits depends on it.
The mechanism linked to the volume of production seems simpler and easier for States but seems to be less objective and equitable than the model based on profitability. However, in both cases, the monitoring and control of production and cost declarations is very important to minimize false declarations and product trafficking in order to optimize the oil revenues of the States.
Table 6 below shows the mechanism used in some countries.
| COUNTRY | OIL-PROFIT SHARING MECHANISMS | PROFIT OIL DE L’ETAT (%) | |
|---|---|---|---|
| Daily or cumulative production | R-factor or RoR | ||
| BENIN | - | R |
40 to 65% Contract area between 0 and 1000 m water depth
Contract area beyond 1000 m water depth
|
| GHANA | - | RoR |
0 to 25%
|
| COTE D’IVOIRE | Daily production modulated by a factor of H) | - |
Negotiable 32.5% to 47.5% modulated by an H-factor for the contractor (Eni -2019 contract) i.e. 100-(32.5xH) to 100-(47.5xH) for the State H=1.626 – 0.141Ln (oil price deflated as of December 2011) |
| NIGERIA | Cumulative production in millions of barrels (Pc) | - |
5 to 45%
|
| SENEGAL | - | R |
40 to 60%
|
| NIGER | - | R |
40 to 60%
|
4.2.4- Profit/corporate tax
Normally, oil companies are subject to the payment of income tax. However, in the tax laws of the countries we study, the policy for paying corporate taxes varies, depending on their strategy to attract investors. In Benin and Niger, for example, the company does not pay tax directly on its profits. The profit tax is paid in the state’s share of the oil profit. In contrast, in Nigeria, Ghana and Senegal, they are subject to the payment of income tax. For the latter batch of countries, some pay it in accordance with the provisions of the General Tax Code of their country (Senegal for example) and others apply specific rates such as Ghana for example.
The table above shows the summary of income taxes in the countries covered by this work.
| Country | Income taxes (%) |
|---|---|
| Benin | (paid in the share of oil profit of the State) |
| Ghana |
|
| Ivory Coast | (generally paid in the share of oil profit of the State, conferred ENI-2019 contract) |
| Nigeria |
|
| Senegal |
|
| Niger | (paid in the share of oil profit of the State) |
Looking at this data, Nigeria has the highest rate in West African countries, followed by Ghana. It can therefore be deduced that countries with enormous proven oil resources apply a more comfortable rate in their tax system in order to maximize their profit in the exploitation of their resources. For countries such as Benin and Niger and even Côte d’Ivoire (in some of its contracts), profit oil and profit tax are therefore not separate and constitute a single tax for the benefit of the contractor, i.e. the international oil company. It is desirable to separate these two concepts.
4.2.5-State participation
The State that owns the oil resources has the right to participate in oil operations in accordance with the procedures defined by the Oil Law. This participation consists of the taking of a share of the share which may be carried by the contracting party or directly for consideration. This state participation is generally managed through the intermediary of the national hydrocarbon companies. The acquisition of shares in oil operations allows States to:
-
maximize the revenues from the exploitation of their resources through the dividends that its participation will generate as a shareholder and stakeholder or co-contractor;
-
better control of the operations and interests of the State
-
acquire and develop national expertise in the conduct of petroleum operations.
The table below summarises the level of participation of States in the countries covered by this study.
| Country | Initial Ownership (%) | Additional participation (%) | Total (%) |
|---|---|---|---|
| Benin | 10 to 15 | possible | 15 |
| Ghana | 15 | 5 | 20 |
| Ivory Coast | 10 | 12 | 22 |
| Nigeria | 60 | - | 60 |
| Senegal | 10 | 20 | 30 |
| Niger | 10 to 20 | - | 20 |
Table 8: State participation rate in selected West African countries
An analysis of this table shows that only Nigeria has a high initial participation rate, which is above average, i.e. higher than that of the international oil company. As a result, it will increase its oil revenues very considerably. This risk-taking by Nigeria could be explained by the fact that the geological risk is lower in Nigeria, which has a proven enormous potential in oil resources. The other countries have an initial participation (between 10 and 20%) that is still very low in order to have real control over their resources and substantially increase their oil rent.
However, the paradox in analyzing this table is that these countries with relatively low potential are still hesitant to increase their participation after a discovery. Thus, the additional participation is between 5 and 20% in these countries.
The State’s participation is an essential and decisive element of the tax system allowing the State to increase its oil rent through dividends proportionally generated to the States according to their level of participation.
For this reason, it is desirable that these countries dare to improve their legislation on additional participation, which can enable them to hold a total participation of at least 50% in the exploitation phase.
On the other hand, the efforts of the States to participate constitute an act of sharing geological, technical, economic and political risk that reassures foreign investors for the implementation of projects.
Table 9 below summarizes the key elements of the tax systems of the six countries covered by this study. These elements make it possible to determine the share of the oil rent accruing to the State and the contractor.
- In-depth analysis of tax regimes by country
4.3.1- Nigeria
Nigeria’s tax system is one of the most complex in the region, the result of decades of incremental change. The 2021 Petroleum Industry Law (PIA) consolidated many of these elements, establishing a dual tax structure: a hydrocarbon tax and a corporate tax, and revising the royalty framework.
Royalties now vary depending on the land and production levels. Deepwater projects benefit from relatively low rates, while onshore and shallow water operations are subject to higher rates, including price-related components that accentuate escalation. Historically, Production Sharing Agreements (PSCs) allowed for cost recovery caps of up to 80%, which encouraged investment but delayed early tax revenues for the government. The Public Investment Act (PIA) corrected this imbalance by capping it at 70%, although implementation challenges remain, particularly in terms of cost verification and regulatory coordination.
Nigeria offers strong resource potential and high growth potential, but this is offset by fiscal complexity and operational risks.
4.3.2- Ghana
Ghana is often considered one of the most balanced and transparent regimes in the region. Its system combines elements of Production Sharing Agreements (PSAs) with corporate taxation, creating a structure that is both progressive and relatively simple. Royalties are typically between 5% and 12.5%, with cost recovery caps of 20%. The share of oil profits increases with profitability, and corporate tax is around 35%.
The strength of the Ghanaian system lies in its institutions. The Oil Revenue Management Act provides a clear framework for their distribution, while participation in the Extractive Industries Transparency Initiative strengthens accountability. The main challenge is to maintain competitiveness in the face of increasingly selective global investment demand.
4.3.3- Senegal
Senegal’s tax framework reflects its status as an emerging producer. Production Sharing Agreements (PSAs) offer relatively low royalties and high cost recovery caps, recognizing the importance of the investments required in offshore oil and gas development. The distribution of oil profits is progressive and the state’s participation is managed by Petrosen, usually with interests carried over during exploration.
The framework also includes provisions on the domestic use of gas, in line with the broader energy policy objectives. As Senegal enters the production phase, maintaining transparency and institutional discipline will be essential.
4.3.4- Côte d’Ivoire
Côte d’Ivoire has developed a competitive system based on production sharing contracts (PSCs) with moderate royalties and cost recovery limits between 60 and 80%. The terms for sharing oil profits are flexible and often tailored to the specific risks of each project, which has helped attract investment, especially in deepwater exploration.
Recent discoveries at sea demonstrate the effectiveness of this approach. However, as production increases, the government will need to balance competitiveness and revenue optimization, while continuing to strengthen institutions and maintain transparency.
4.3.5 - Benin and Niger
Both countries have relatively simple tax systems, based on moderate royalties and with corporate taxation not segregated from the share of their oil profits. Their regulatory frameworks are functional but need to be strengthened, which reflects the small size of their oil sectors, particularly in Benin. The distribution of profits in these two countries is progressive and the State’s participation is managed, as in Senegal, by their National Hydrocarbons Company (SNH-Benin and SONIDEP).
Like Côte d’Ivoire, Benin has adopted a highly incentivizing oil cost recovery limit of up to 80% to take into account the difficulties and risks of huge investments in the deep and very deep seas.
4.3.6- Other West African countries
- Mauritania
Mauritania’s tax regime reflects its growing role as a gas producer. Production Sharing Agreements (PSAs) provide for moderate royalties and cost-recovery provisions tailored to large offshore gas projects. Coordination with Senegal on the Grand Tortue Ahmeyim project complicates the system, but also makes it possible to achieve efficiency gains through the pooling of infrastructure.
Institutional capacity remains a constraint, and the effective management of future gas revenues will be critical to long-term economic development.
- Sierra Leone and Liberia
Both countries offer relatively advantageous tax conditions – low royalties and high cost recovery caps – to compensate for significant geological and political risks. Despite this, the success of exploration remains limited, highlighting the inadequacy of tax incentives. Weak institutions and lack of infrastructure continue to hold back investment.
- Guinea and Guinea-Bissau
These border territories also rely on advantageous tax conditions to attract exploration activities. However, political instability and governance challenges remain significant obstacles. Without broader institutional improvements, tax incentives are unlikely to generate sustainable investment.
- The Gambia
The Gambia is still in its infancy in terms of sectoral development. Its tax framework aims to reduce barriers to entry, through low royalties and flexible production sharing contract (PSC) terms. As exploration progresses, the system will have to evolve in order to reconcile competitiveness and fair exploitation of exploitation.
| Country | Royalty (%) | Cost Stop / Depreciation (%) | Oil State profit (%) | Income tax (%) | State participation (%) | ||
|---|---|---|---|---|---|---|---|
| Common/ Fashion | Fashion | ||||||
| Benin | 10 to 15 | 12.5 | 70 to 80 | 75 | 40 to 65 | 25 (paid from the State's share of the oil profit) | 10 to 15 (of which 10% ranged) |
| Ghana | 5 to 12.5 | 10 | 20 | 20 | Grants Additional Oil Draw (0 to 25) | 35 | 15 to 20 (15% free) |
| Ivory Coast | - | - | 60 to 80 | 75 | Sharing key negotiable according to daily production. Ex: Eni Block 501 contract: 32.5 to 47.5 modulated by an H factor | 25 (ENI contract: paid out of the State's share of the oil profit) | 10 to 22 (only 10% free of charge) |
| Nigeria | 7.5 to 15 | 10 | 60 to 70 | 65 | 5 to 45 | 50 | 60 |
| Senegal | 7 to 10 | 9 | 55 to 70 | 60 | 40 to 60 | 30 | 10 to 30 (only 10% free litter) |
| Niger | 15 | 15 | 70 | 70 | 40 to 60 | 25 (paid from the State's share of the oil profit) | 10 to 20 (of which 10% worn) |
- State/Contractor income associated with the tax system in selected West African countries
The calculation of the parties’ cash flow on the basis of the tax terms negotiated and agreed in the contracts of the countries subject to this study between the State and the contractor is carried out in a flow chart of cash flows.
The flow chart will illustrate how in each country subject to our study, 100 barrels of crude oil are distributed between the contractor and the State.
Thus, considering the data recorded in Table 9 above, the distribution of the cash flow of the different parties to the contract from the respective tax regimes of Benin, Ghana, Côte d’Ivoire, Nigeria, Senegal and Niger, is as follows (Figure 25 to 30):
STATE
10
Post-royalty income: 90
Taxable
0
14,85
Net cash flow
-2,23
+ 2,23
State participation
15%
2,23 (SNH-BENIN)
12,62
Partner net cash flow
75,62
Total gross cash flow of the contractor
Figure 25: Simplified organizational chart showing the share of the State and the Contractor in the taxation associated with the CPP of Benin
Corporate tax:
35%
+20,82
-20,82
Total gross cash flow of the contractor
52,88
Figure 26: Simplified organizational chart showing the share of the State and the Contractor in the taxation used in the Ghana model contract
Taxable: 0
86,5
13,5
Gross cash flow
Total gross cash flow of the contractor
85,35
Figure 27: Simplified organizational chart showing the share of the State and the contractor resulting from the taxation associated with the CPP of Côte d’Ivoire
12,5
Post-royalty income: 87.5
+14,55
-14,55
Profit tax: 50%
14,55 (29,1-14,55)
Net cash flow (CPI+NNPC)
-8,73
State participation: 60%
+8.73 (NNPC)
Total gross cash flow of the contractor
62,69
Figure 28: Simplified organizational chart showing the share of the State and the Contractor in the taxation associated with the CPP of Nigeria
9
Post-royalty income: 91
+5,46
-5,46
Profit tax: 25%
16,38
Net cash flow (CPI+PETROSEN)
-1,64
State participation: 10%
+1,64
69,34
Total gross cash flow of the contractor
Figure 29: Simplified organizational chart showing the share of the State and the Contractor resulting from the taxation associated with the Senegalese CPP
15
Post-royalty income:85
Imposable/taxable :0
15,3
Net cash flow (CPI+SONIDEP)
+1,53
-1,53
State participation: 10%
Total gross cash flow of the contractor
73,27
Figure 30: Simplified diagram showing the share of the State and the Contractor resulting from the taxation associated with the CPP of Niger
Figure 30 :
On the basis of the tax parameters summarized above on the basis of the legislative and regulatory texts of the six countries that were the subject of this study, the proportions of the States’ oil revenues in relation to the earnings of the CPIs (contractors) are presented in Tables 9 and 10 and the graphs below (Figures 31 and 32).
Table 10 shows the percentage of oil rent accruing to the State and the contractor after deduction of the expenditure incurred on oil extraction. This distribution is therefore made on the basis of the real economic value of oil, i.e. the net value of the expenses for its extraction.
| Country | Contractor's share (%) | Government share (%) | ||
|---|---|---|---|---|
| Government | Part SNH | Total State | ||
| Benin | 34,1 | 59,88 | 6,02 | 65,9 |
| Ghana | 41,1 | 51,65 | 7,25 | 58,9 |
| Ivory Coast | 41,4 | 54 | 4,6 | 58,6 |
| Nigeria | 13,5 | 66,26 | 20,24 | 86,5 |
| Senegal | 32,47 | 63,92 | 3,61 | 67,53 |
| Niger | 34 | 62,22 | 3,78 | 66 |
Table 11 shows the overall cash flow distribution scheme between the parties based on 100 barrels of oil extracted. The oil share for the repayment of investments is added to the contractor’s income.
| Country | Cash Flow | |
|---|---|---|
| Contractor | Status | |
| Benin | 75,62 | 24,38 |
| Ghana | 52,88 | 47,12 |
| Ivory Coast | 85,35 | 14,65 |
| Nigeria | 62,69 | 37,31 |
| Senegal | 69,34 | 30,66 |
| Niger | 73,27 | 26,73 |
Figure 31: Graph showing the share of net profit accruing to the CPI and the States according to the tax regime applicable in these States
Figure 32: Graph showing the distribution of the cash flow between the State and the contractor considering 100 barrels of oil extracted
-
Analysis and interpretations
- On the net income of States/contractors and attractiveness to foreign investment
It appears from the analysis of the graph in Figure 31 and Table 10 that Nigeria’s tax system offers a better oil rent (net cash flow) for the State (more than 86%) due to the State’s participation of 60% through its National Company NNPC and the tax on profits (tax oil) which is 50%. Despite this apparently very high profit margin for the state, Nigeria remains attractive to foreign investors because of the very high prospectivity of its sedimentary basins. Nigeria’s option to participate financially in oil operations is supported by its very high prospectivity and its policy of capturing more dividends in the profits accruing to the various partners in the contract through its national company.
Côte d’Ivoire and Ghana offer, according to their contract economic model, an attractive tax regime compared to that of Benin, Senegal and Niger. The results of the determination of the cash flows accruing to their respective countries (Côte d’Ivoire and Ghana) show that they make a net profit of about 59% of their oil resources while the foreign contractor earns a profit of about 41%.
For Côte d’Ivoire, the low proportion of its oil revenues (58.6%) can be explained by two fundamental reasons:
-
First, zero royalties adopted in its legislation and
-
second, the absence of direct deduction of tax on profits for CPIs (confers 2019 ENI contract on block CI-501), like the legislation of Benin and Niger which provides for the payment of tax on profits in the share of oil profit accruing to the State.
Thus, an examination of the tax regime applied to Côte d’Ivoire’s petroleum code shows that it derives less profit from its oil resources compared to the other five countries. The Ivorian strategy, through the adoption of such a fiscal policy in its production sharing contract, certainly aims to promote the competitiveness of its sedimentary basin in the West African sub-region, particularly in the face of Ghana, Benin, and Nigeria, which are countries located in the same geological environment of the Gulf of Guinea. This strategy has also borne fruit in view of the large number of oil contracts signed over the last ten years.
The same is true for Ghana’s tax system, described as hybrid, i.e. a combination of the concession system and the CPP by the “Ghana Petroleum Commission in 2016”, which offers almost the same competitiveness as that of Côte d’Ivoire with the signing of contracts with several oil companies in recent years.
Given that Côte d’Ivoire and Ghana have proven a significant prospectivity of their sedimentary basins through several discoveries that have followed one another in recent years, it is essential that they review their tax policies and regulations in order to maximize their oil revenues and create the conditions for more sustained development because the impact of oil and gas exploitation does not yet seem to be very noticeable in terms of the quality of services energy and industrial development. Energy needs are clearly increasing in these countries and in most countries of the subregion.
The determination of the cash flow on the basis of the tax elements of the 2019 petroleum code in Benin shows that the net income for the contractor (CPI) is 34.1%, practically in the same size as that of Niger (34%) and slightly higher than that of Senegal (32.47%). The income of the foreign partner (CPI) in these countries is much lower than that of Ghana and Côte d’Ivoire, which are around 41%. It is clear that Senegal, Benin and Niger are less attractive from a tax point of view for foreign investment than Ghana and Côte d’Ivoire in terms of their tax regimes. The attractiveness of Nigeria’s tax regime is mainly linked to its large proven oil potential, which considerably reduces the financial risk associated with the absence of discovery at the IPCs.
As a result, the absence of oil contracts over the past ten years in Benin, a country that is very close to Nigeria, Ghana and Côte d’Ivoire, could be explained by its unattractive tax policy adopted in 2019 added to its little-known oil potential (obvious geological and financial risk for the CPIs).
As Benin’s oil potential is still very little known, it would be much more desirable to act on the parameters that make Benin’s tax system regressive, namely the reduction of “incidental expenses” such as bonuses, legal and financial assistance fees and other fees paid upstream, i.e. not based on profitability. This improvement would make our code more attractive and competitive.
- On the overall State/Contracting Party cash flows
The oil rent thus generated by these tax regimes for each country, as shown in Table 10, is an apparent value because it is conditioned by the control by the States of the costs invested by the contractor. These benefits for the parties are only real if the States control the oil costs invested by the contractor. This control or control of costs is not generally a reality in our African countries where there is a great weakness and inadequacy in the monitoring of the oil costs actually invested by the CPIs.
The control of oil costs is therefore a fundamental element that characterizes the reliability of the oil rent that goes to the States. These costs are most of the time subject to manipulation aimed at inflating them excessively, since the higher the investment declared by the contractor, the lower the profit margin to be shared by the parties. Thus, the bulk of the oil produced is generally intended to repay oil costs during the first five years of production.
Table 11 and the graph in Figure 32 illustrate the reality of the oil rent of the States of the West African sub-region according to their tax regime. The results clearly show that out of 100 barrels of oil produced, more than 50% goes to the contracting international oil companies during the first years of production during which the CPIs have to recoup their investments.
Careful analysis of this table shows that Ghana’s tax system is more responsible and advantageous with 47.12 barrels out of 100 barrels produced for the state. This profit margin, which is better than in other States, is the consequence of the 20% straight-line depreciation rate adopted for the reimbursement of oil costs, unlike the other States which have opted for a cost stop of between 60 and 80% indexed to production. It is followed by Nigeria, which takes about 37.31% of production because of its high state shareholding, which maximizes its share of oil profit.
Côte d’Ivoire has the least advantageous tax regime in the sub-region, as it takes less than 15 barrels (14.65 barrels) for every 100 barrels produced, during the first years of production. It is followed in this “sell-off” of hydrocarbon resources to the benefit of foreign investors by Benin, Niger and Senegal with a share of 24.38, 26.73 and 30.66 barrels per 100 barrels produced, respectively.
4.6- Some suggestions for maximizing the oil revenues of the States
In view of the above analyses and comments, two parameters of tax regimes can serve as levers to maximize oil revenues in West African countries when they are well controlled and negotiated in oil contracts by government authorities or actors. These are oil costs and the State’s participation.
4.6.1 - Recoverable Petroleum Costs
The recovery scheme for the oil costs invested by the contractor, generally based on a cost stop, long considered as an incentive parameter for the CPI when it is high, is also an element whose lack of control favours the levelling of the oil rent of the States in the sense that it limits the possibility for the States to make better use of their resources during the first years of production. This parameter also influences the distribution key of the oil profit. This is why we suggest that States:
-
Adopt an oil cost recovery scheme that does not take into account production but rather a cost amortisation model that can provide a considerable amount of profit to share in oil.
-
review the model or margins of very high cost stop proposed in the tax systems of the States. The cost stop is a very difficult element for our States to control and a very high ceiling does not favour the State to have an appreciable oil rent.
-
train specialists in oil cost control, auditing and management and rigorously monitor exploration and development and even operating costs.
4.6.2- State participation
The rate of state participation in oil development and production projects is a very important additional means of increasing the profit margin of states in oil contracts. It is also a responsible and sustained way to boost the confidence of foreign investors as well as political stability.
As a result, it is hoped that States will start by investing better in oil projects, particularly in its exploitation phase. The problem of financing by the Liberals through a substantial participation remains a subject of great concern. To this end, we suggest:
-
a pooling of efforts between African states to raise funds as shareholders in oil projects
-
the creation of the African or Regional Bank for the Financing of Oil Projects, the majority of whose shareholders will be African countries.
- Partial conclusion
Comparative analysis of tax regimes shows that in West Africa, there is a clear correlation between tax conditions, geological maturity and perceived risk. Established producing countries, such as Nigeria and Angola, tend to enjoy a larger share of government revenues, while emerging market economies offer more favourable conditions for attracting investment. Tax competitiveness is not static: it evolves with oil prices, technological advances, and global capital flows. Governments must constantly adapt their systems to remain attractive while protecting their national interests.
The global energy transition is beginning to influence the design of tax policies. There is an increasing focus on gas exploitation, emissions management and decommissioning obligations. At the same time, digital technologies are improving tax administration, allowing for better monitoring of production and costs, and reducing the risk of revenue losses.
Overall, tax regimes and contractual frameworks are at the heart of the governance of the oil sector. West African systems have evolved significantly, but challenges remain, including in terms of institutional capacity, transparency and long-term competitiveness. As the global energy landscape continues to evolve, countries will need to adapt their approaches to remain attractive to investors while ensuring sustainable incomes.
Chapter 5: Key Socio-Political Determinants of Oil Sector Performance
The oil sector occupies a prominent place in the global economy, ensuring national energy security, fiscal stability, and geopolitical power. For many hydrocarbon-rich countries, oil and gas revenues make up a significant portion of government revenues, export earnings, and foreign exchange reserves. In some cases, notably in Africa, the Middle East and Latin America, these revenues account for more than 50% of total government revenues and more than 80% of export earnings (World Bank, 2023; IMF, 2023). This concentration of economic value within a single sector underscores the importance of the institutional and political context in which it operates.
However, the same characteristics that make the oil sector economically vital (capital-intensive, large-scale infrastructure, complex contractual arrangements, and large revenue streams) also create conditions that are highly vulnerable to governance failures and corruption. This sector often involves long-term contracts spanning several decades, large initial investments and interactions between multinationals, national oil companies and government entities. These factors multiply the points of discretion that, in the absence of strong governance, can foster rent-seeking and corrupt practices.
Political stability, quality of governance, and corruption are therefore not secondary considerations; they are key determinants of the performance, attractiveness of investment, and long-term viability of oil sector projects and programs. A stable policy environment provides predictability and security for investment, while strong governance ensures effective and transparent management of resources. Conversely, weak governance and high levels of corruption can lead to misallocation of resources, reduced investment, operational inefficiencies, and social unrest.
This chapter provides an in-depth analysis of these interrelated factors. It examines the influence of political stability on investments and operations, explores the role of governance structures in sector performance, and analyzes the mechanisms and impacts of corruption along the oil value chain. Drawing on data and analysis from institutions such as the World Bank, Transparency International, the International Energy Agency (IEA) and the Extractive Industries Transparency Initiative (EITI), this chapter aims to provide a detailed and well-informed understanding of the challenges and opportunities related to the management of petroleum resources in complex policy contexts.
5.1-Political stability and its impact on the oil sector
Political stability is an essential condition for the smooth functioning of the oil sector. It depends on a government’s ability to maintain order, uphold the rule of law, and create a predictable political environment. In resource-rich economies, political stability is of particular importance due to the long-term nature and large capital required for oil and gas investments.
The World Bank’s Global Governance Indicators define political stability as the likelihood of political instability and/or politically motivated violence, including terrorism (World Bank, 2024). This definition highlights institutional resilience and the absence of disruptive conflict as essential components of stability. In concrete terms, investors interpret political stability through indicators such as the continuity of government policies, the reliability of legal systems, and the safety of property and personnel.
The link between political stability and investment in the oil sector is well established. Oil and gas exploration and production projects often require multibillion-dollar investments and can take years or even decades to reach production. Therefore, investors need to be assured that tax conditions, contractual arrangements and regulatory frameworks will remain stable over time. Even minor uncertainties can have a significant impact on the profitability of projects, especially in marginal deposits or frontier exploration areas.
Empirical data confirm this correlation. The International Energy Agency (IEA, 2023) indicates that a large majority of global upstream oil and gas investments are concentrated in countries with relatively high political stability and governance. Conversely, politically unstable regions tend to experience lower levels of investment, higher financing costs and reduced participation in tenders. Investors often build political risk premiums into their cost of capital, which can make some projects unprofitable.
Political instability can also have immediate and tangible repercussions on operations. In areas affected by conflict or civil unrest, oil and gas infrastructure can become the target of sabotage or theft. The safety of personnel then becomes a major concern, often requiring the evacuation of the latter or the suspension of operations. Supply chains can be disrupted, leading to delays in drilling campaigns, maintenance activities, and production schedules.
In addition to these operational risks, political instability can lead to abrupt changes in policies and regulatory frameworks. A change of government can result in the renegotiation of contracts, changes in tax conditions, or even the expropriation of assets. Such measures undermine investor confidence and can have lasting consequences on a country’s reputation as an investment destination. The United Nations Conference on Trade and Development (UNCTAD, 2023) notes that foreign direct investment flows can fall significantly following major events of political instability, with some countries experiencing declines of up to 40% in the year following a coup or major political crisis.
5.2- Governance Structures in the Petroleum Sector
Governance in the petroleum sector refers to the systems, institutions, and processes by which resources are managed, regulated, and monetized. Effective governance ensures that petroleum resources are developed in a way that maximizes economic benefits while minimizing environmental and social impacts. It also plays a critical role in ensuring transparent and equitable revenue collection and distribution.
The institutional architecture of the petroleum sector is generally based on multiple entities with distinct roles and responsibilities. Ministries of Energy or Petroleum are usually responsible for policy development and strategic direction. Regulatory authorities oversee licensing, compliance, and technical standards. National oil companies are often directly involved in exploration and production activities, either independently or in partnership with international oil companies. Tax administrations are responsible for the collection of taxes, fees, and other payments.
The effectiveness of these institutions varies considerably from country to country. In effective governance systems, roles and responsibilities are clearly defined, and transparency and accountability are high. Regulatory processes are predictable and decisions are made according to specific criteria. Conversely, weak governance systems are characterized by overlapping mandates, lack of transparency, and significant discretion, all of which can contribute to corruption and inefficiency.
The World Bank’s Governance Indicators provide a useful framework for assessing the quality of governance. Dimensions such as government efficiency, quality of regulation, rule of law, and anti-corruption are particularly relevant to the oil sector. Countries scoring high on these indicators tend to have more efficient and transparent oil sectors, a stable regulatory environment, and strong investor confidence.
Norway is often cited as an example of good governance in the oil sector. The country has a strong institutional framework in place that separates policy-making, regulatory and trade activities. Revenues from the oil sector are managed through the Global Public Pension Fund, which operates under strict transparency and accountability requirements (IMF, 2023). This model has enabled Norway to avoid many of the governance challenges of resource-rich economies.
Conversely, many resource-rich countries face governance issues that limit the benefits of their oil resources. The “resource curse” theory suggests that countries with abundant natural resources often experience lower economic performance and institutional development. This paradox is largely attributed to governance failures, including poor revenue management, lack of diversification, and high levels of corruption (Sachs & Warner, 1995; NRGI, 2022).
5.3- Corruption in the oil sector
Corruption is one of the major challenges in the oil sector. It can manifest itself at different levels of the value chain and take many forms, ranging from corruption and embezzlement to more complex systems involving public procurement fraud and mismanagement of revenues. The scale and complexity of the sector, combined with the high value of transactions, make it particularly vulnerable to corrupt practices.
Transparency International consistently ranks the extractive industries among the sectors most exposed to corruption risks (Transparency International, 2024). One of the main areas of concern is the allocation of exploration and production licences. The procedures for granting these permits often leave significant room for manoeuvre, especially in jurisdictions where regulatory frameworks are weak or poorly enforced. This promotes corruption, favoritism, and a lack of transparency in decision-making.
Procurement procedures also present significant risks of corruption. The oil sector relies on an extensive network of contractors and suppliers, creating opportunities for over-invoicing, bribery and collusion. The World Bank (2021) estimates that corruption in public procurement can increase project costs by 10% to 30%, severely undermining their economic viability.
Operational corruption is another major problem, particularly in land areas. It encompasses activities such as oil theft, illegal production, and manipulation of production data. In some regions, organized criminal networks are involved in the large-scale theft of crude oil, resulting in considerable revenue losses. For example, Nigeria has suffered significant losses due to oil theft, estimated at several hundred thousand barrels per day during peak periods (NNPC, 2022).
Revenue management is arguably the most consequential area of corruption in the oil sector. Poor revenue management can undermine the economic benefits of resource extraction and contribute to social and political instability. Problems such as off-budget spending, lack of transparency of sovereign wealth funds, and misappropriation of funds are common in poorly governed systems. Initiatives like the Extractive Industries Transparency Initiative (EITI) aim to address these challenges by promoting transparency and accountability in revenue reporting.
5.4- Interrelationship between stability, governance and corruption
Political stability, governance and corruption are closely linked and often feed into each other through complex feedback mechanisms. Weak governance structures foster corruption, which in turn undermines effective institutions and public trust. This erosion of trust can lead to political instability, further weakening governance and creating a vicious cycle that is difficult to break.
Empirical data confirm this correlation. Countries with high levels of corruption tend to have less political stability and weaker governance institutions. Transparency International’s Corruption Perceptions Index shows that countries with a low score often face greater political risks and economic volatility (Transparency International, 2024). In the oil sector, this translates into disruptions in production, lower investment and lower tax revenues.
Conversely, countries that have been successful in strengthening governance and reducing corruption tend to experience greater political stability and more effective resource management. This underlines the importance of integrated approaches that simultaneously take into account these three dimensions.
5.5- Stakeholder Risk Mitigation Strategies
5.5.1- Roles of operators
Oil operators have to deal with complex political and governance environments. Effective risk management strategies are therefore essential. These include the use of political risk insurance, diversification of assets across multiple jurisdictions, and active dialogue with host governments and local stakeholders.
Compliance with international anti-corruption frameworks is also essential. Companies are increasingly adopting rigorous compliance programs, aligned with regulations such as the UK Bribery Act and the US Foreign Corrupt Practices Act (FCPA). These programs typically include measures such as third-party due diligence, internal audits, and employee training.
Digital technologies are also playing an increasingly important role in reducing the risks of corruption. Tools such as blockchain and digital purchasing platforms can improve transparency and traceability, limiting opportunities for discretionary decision-making.
5.5.2 - Responsibilities of States
In order to mitigate the risks of corruption and political instability, governments and policymakers have a responsibility to strengthen or establish oil sector governance institutions, a policy and a legislative and regulatory framework that guarantees transparency and equitable management of resources for the benefit of all my people. This implies the need to put in place tools for the control and monitoring of all phases of oil operations, to encourage national participation and to ensure better management of oil activities in terms of the environment, safety and health.
5.5.3- Roles of international institutions
International institutions play a key role in promoting good governance and reducing corruption in the oil sector. The EITI, for example, requires participating countries to publish information on payments and revenues, promoting transparency and accountability. As of 2024, more than 50 countries were implementing the EITI Standard.
The World Bank and the International Monetary Fund are providing technical assistance and support for governance reforms, including the development of tax frameworks and regulatory systems. The OECD Anti-Bribery Convention sets international standards to combat bribery of foreign public officials.
5.6-Future trends and emerging risks
The global energy transition presents both challenges and opportunities for the governance of the oil sector. As demand for fossil fuels evolves, fossil fuel-dependent economies could experience lower revenues, reinforcing the importance of effective governance and diversification strategies.
At the same time, advances in digital technologies are improving transparency and accountability. However, these developments also require strong institutional capacities and strengthened cybersecurity measures.
Environmental, social and governance (ESG) criteria are becoming increasingly important to investors. Companies operating in jurisdictions with weak governance or high corruption may face higher financing costs or reduced access to capital.
Chapter 6: West Africa: In-Depth Country Analysis
6.1- Nigeria
Nigeria is Africa’s largest oil producer and one of the world’s largest hydrocarbon producers. Historically, the country’s oil sector has been the backbone of its economy, accounting for about 90% of export earnings and nearly 50-60% of government revenue (World Bank, 2023; OPEC, 2023). Despite these considerable resources, Nigeria presents a complex case where political instability, governance issues, and systemic corruption have severely hampered the performance of the sector.
In Nigeria, political stability is more aptly described as uneven than non-existent. At the federal level, democratic governance has been maintained since 1999, ensuring a certain institutional continuity. However, subnational instability, particularly in the Niger Delta, has a direct and persistent impact on oil operations. The region has been plagued by decades-long insurgency, pipeline sabotage and communal strife, often fuelled by grievances over environmental degradation, income distribution and a sense of marginalisation. These dynamics have created significant operational risks, particularly for land-based facilities, whose infrastructure is particularly vulnerable.
The governance framework of Nigeria’s oil sector has undergone significant reforms in recent years, including the enactment of the Petroleum Industry Act (PIA) in 2021. The Act was intended to address persistent issues related to regulatory fragmentation, financial uncertainty, and inefficiency of the Nigerian National Petroleum Corporation (NNPC), which has since been restructured into a commercially oriented entity, NNPC Limited. The Act established new regulatory bodies, including the Nigerian Upstream Petroleum Regulatory Commission (NUPRC) and the Nigerian Midstream and Downstream Petroleum Regulatory Authority (NMDPRA), to improve transparency and operational efficiency.
Although the Natural Resource Assessment (ERN) represents a major step forward, implementation challenges remain. Institutional capacity constraints, bureaucratic inertia and overlapping mandates continue to limit the effectiveness of regulatory reforms. According to the Natural Resource Governance Institute (NRGI, 2022), Nigeria has average scores on resource governance, but continues to face significant challenges regarding revenue management and transparency.
Corruption remains one of the most critical issues affecting Nigeria’s oil sector. Transparency International’s Corruption Perceptions Index consistently ranks Nigeria as a country with a high risk of corruption (Transparency International, 2024). Corruption occurs at all levels of the value chain, from licensing and contracting to procurement and revenue management. Historically, the lack of transparency in licensing procedures and the discretionary nature of award processes have raised concerns about fairness and accountability.
One of the most significant forms of corruption and crime in Nigeria is oil theft, commonly known as “subkering”. It is the illegal diversion of crude oil from pipelines to sell it on the black market. The Nigerian National Petroleum Company (NNPC) reported losses of up to 200,000 barrels per day at peak activity (NNPC, 2022), representing a significant loss of revenue for the state. This problem is compounded by weak enforcement mechanisms and, in some cases, alleged collusion between criminal networks and security forces.
Operationally, these challenges translate into higher costs and lower efficiency. Operators need to invest heavily in security, surveillance, and dialogue with local communities to mitigate risks. As a result, offshore projects have become more attractive, given their relative protection against land-based security problems. However, these projects involve higher capital expenditure and longer development times, which can offset some of these benefits.
Despite these challenges, Nigeria still has considerable potential. The country has significant untapped reserves, particularly in deep-water basins and border basins. Ongoing reforms under the PIA, combined with efforts to improve transparency and attract investment, could boost the sector in the long term. However, sustained progress will depend on the government’s ability to address underlying governance and corruption issues, while preserving political stability.
6.2- Ghana
Ghana represents a positive example of governance and political stability in the West African oil sector. Since the discovery of commercial oil in the Jubilee field in 2007, Ghana has put in place a relatively strong institutional framework for the management of its petroleum resources. The sector contributes significantly to government and export revenues, although it is less preponderant than in countries such as Nigeria and Angola (World Bank, 2023).
Politically, Ghana is widely regarded as one of the most stable democracies in Africa. The country has experienced peaceful transitions of power and remains firmly committed to the rule of law. This stability has been a key factor in attracting investment in the oil sector, especially in the early stages of its development.
Ghana’s governance framework is characterized by a clear separation of roles among key institutions. The Ministry of Energy is responsible for energy policy, the Petroleum Commission regulates upstream activities, and the Ghana National Petroleum Corporation (GNPC) handles business operations. This institutional clarity has contributed to a more transparent and efficient regulatory environment.
Ghana is also a member of the Extractive Industries Transparency Initiative (EITI) and has mechanisms in place for the publication of oil revenues and contracts. The Petroleum Revenue Management Act (PRMA) sets out the rules for the allocation and use of these revenues, including the establishment of the Ghana Petroleum Fund. These measures have helped to strengthen transparency and accountability.
Despite these strengths, challenges remain. The risks of corruption, although lower than in some neighbouring countries, are not non-existent. Issues related to public procurement, contract management, and local content implementation were identified as areas of concern (NRGI, 2022). Ghana is also facing pressures related to revenue volatility and fiscal management, especially in the context of oil price fluctuations.
Operationally, Ghana’s offshore production reduces exposure to certain security risks associated with onshore environments. However, the country needs to continue to invest in its regulatory capacity and infrastructure to support the growth of the sector. Ensuring the effective implementation of local content policies, without creating inefficiencies or opportunities for corruption, will be a major challenge.
Overall, Ghana’s experience demonstrates that strong governance and political stability can significantly improve the performance of the oil sector. Despite the ongoing challenges, the country offers a useful model for other resource-rich nations looking to improve their governance and transparency.
6.3- Senegal
In recent years, Senegal has established itself as one of the most promising new hydrocarbon producers in West Africa. The discovery of significant offshore oil and gas reserves, including the Sangomar oil field and the Grand Tortue Ahmeyim (GTA) gas project (shared with Mauritania), has positioned Senegal as a major player in the regional energy landscape. Unlike historical producers such as Nigeria and Angola, Senegal is at an early stage of development in its sector, which represents a crucial opportunity for the establishment of strong governance frameworks from the outset.
Politically, Senegal is widely regarded as one of the most stable democracies in West Africa. The country has a long tradition of peaceful political transitions and relatively strong institutional structures. This stability has been instrumental in attracting international oil companies and boosting investor confidence. According to the World Bank (2023), Senegal ranks comparatively well among countries in the region in terms of governance indicators.
The governance framework for Senegal’s oil sector has been developed with a focus on transparency and institutional clarity. The Ministry of Petroleum and Energy oversees policy, while regulatory functions are carried out by specialized agencies. Senegal has also joined the Extractive Industries Transparency Initiative (EITI), reaffirming its commitment to revenue transparency and public accountability.
Despite these strengths, Senegal faces several emerging challenges. With the increase in production, the pressure is increasing to ensure that governance systems can effectively manage large revenue streams. The experience of other resource-rich countries highlights the risk of deteriorating governance in the transition from discovery to production. The Natural Resource Governance Institute (NRGI, 2022) emphasizes that early-stage producers need to prioritize institutional capacity building to avoid the pitfalls of the resource curse.
In Senegal, the risk of corruption is relatively moderate compared to other producing countries in the region, but it remains a concern, particularly in terms of procurement and contract management. As the industry expands, the complexity and scale of transactions will increase, potentially creating new opportunities for rent-seeking.
Operationally, offshore operations in Senegal reduce their exposure to many of the security risks associated with onshore production. However, the country needs to invest in infrastructure, regulatory capacity, and training of the local workforce to support the sector’s long-term growth.
Overall, Senegal has great potential, based on strong political stability and governance. The main challenge will be to maintain these standards as the sector transitions to large-scale production.
6.4- Côte d’Ivoire
After a period of political instability in the early 2000s, Côte d’Ivoire has once again become a major producer of hydrocarbons. Recent deep-sea discoveries, including large deepwater oil and gas deposits, have revitalized the sector and sparked renewed investor interest.
Politically, Côte d’Ivoire has achieved some stability since the resolution of its civil conflict, despite the persistence of underlying tensions. The government has prioritized economic development and institution-building, helping to improve investor confidence. According to the IMF (2023), the country has recorded strong economic growth and increased macroeconomic stability in recent years.
The governance framework for the oil sector is relatively well structured, with clearly defined roles for the Ministry of Petroleum, regulators, and the national oil company, Petroci. Licensing procedures are conducted with increasing transparency, although concerns persist about discretion in contract decisions and negotiations.
The risk of corruption in Côte d’Ivoire is moderate. Transparency International (2024) indicates that, despite progress, challenges remain, particularly in public procurement and state-owned enterprises. The oil sector is not immune to these risks, especially as new discoveries increase the value of contracts and investments.
Revenue management is an area that requires constant attention. As production increases, the government must ensure that revenues are managed transparently and allocated efficiently. Participation in the EITI provides a framework for improving transparency, but its implementation remains essential.
Operationally, Côte d’Ivoire benefits from a majority of offshore production, which reduces its exposure to security risks. However, the exploitation of deep-sea resources requires considerable technical expertise and investment, making the sector sensitive to global market conditions.
In summary, Côte d’Ivoire’s oil legislation is on the verge of recovery and increasingly attractive, with improving governance but persistent risks related to corruption and institutional capacity.
6.5- Benin
Benin has experienced limited hydrocarbon production, mainly focused on small, shallow offshore fields and exploration activities. He has just resumed production on the Sèmè field. The oil sector plays a relatively minor role in their economies.
This country enjoys a stable political environment compared to some neighbouring countries. Its governance framework is modest but functional, and efforts are being made to improve its institutional, legislative and regulatory capacities with the adoption of Law 06 on the Petroleum Code.
The risk of corruption is moderate, with challenges mainly related to public sector governance rather than large-scale extractive activities.
The development of the oil sector in Benin is likely to remain limited unless there are significant new discoveries.
6.6- Niger
Niger is one of the new emerging producing countries in the hinterland. Due to its geographical location, this Sahel country is facing enormous difficulties related to its political instability, its landlocked position which impacts oil operations and especially the evacuation of its crude oil as well as a preponderant security risk that weakens all the Sahel states, especially the oil infrastructure.
Political instability and the absence of democratic governance are challenges for the transparent management of oil rents.
6.7- Other West African countries
Mauritania
Mauritania is an emerging hydrocarbon producer with significant offshore gas potential, notably through its participation in the Grand Tortue Ahmeyim (GTA) project alongside Senegal. Historically, Mauritania’s economy has relied on mining, but recent discoveries have positioned the country as a major player in the gas sector.
Politically, Mauritania has experienced periods of instability, including coups in the 2000s, but has shown increasing stability in recent years. The current political context is relatively stable, although institutional capacity remains limited.
The governance of the oil sector is still developing. The government has made efforts to put in place regulatory frameworks and attract investment, but institutional weaknesses remain a major challenge. According to the World Bank (2023), Mauritania scores relatively low on governance indicators compared to global averages.
The risk of corruption is moderate to high, reflecting broader governance challenges. Transparency International (2024) highlights issues related to accountability and transparency in the public sector. In the oil sector, risks are particularly associated with contract negotiations and revenue management.
The GTA project represents a major opportunity for Mauritania, but also raises governance challenges related to the management of significant gas revenues. Effective coordination with Senegal and international partners will be essential to ensure the success of the project and revenue transparency.
Operationally, offshore gas exploitation reduces some risks, but requires considerable technical and financial resources. Mauritania’s ability to effectively manage these projects will depend on further institutional development and international support.
Sierra Leone
Sierra Leone has experienced intermittent exploration activities in its offshore basins, with several discoveries indicating potential hydrocarbon resources. However, the sector remains underdeveloped and no large-scale commercial production has been implemented to date.
Politically, Sierra Leone has made considerable progress since the end of its civil war in 2002. The country has developed democratic institutions and has experienced relatively peaceful political transitions. However, its governance capacities remain limited, particularly in complex sectors such as oil.
The regulatory framework for the petroleum sector has been developed with the support of international partners, but implementation challenges remain. Institutional capacity constraints and lack of technical expertise have hampered the development of the sector.
The risk of corruption remains a concern. Transparency International (2024) ranks Sierra Leone as one of the countries with moderate to high levels of corruption, particularly in public administration and public procurement. These risks extend to the oil sector, where licensing and contract management require rigorous oversight.
The main challenge for Sierra Leone is the transition from exploration to production, while putting in place strong governance systems. Without strong institutions, the country risks replicating the difficulties faced by other resource-rich economies.
Liberia
Liberia has conducted offshore exploration activities and identified potential hydrocarbon resources, but commercial production has not yet started. The country’s oil sector remains in its infancy, and uncertainty about resource potential remains high.
On the political front, Liberia has made progress in stabilizing its institutions after years of civil conflict. A democratic government has been established, but institutional capacity remains limited.
The governance framework for the oil sector has been developed with a focus on transparency, including through participation in the EITI. However, implementation challenges remain, particularly in the areas of enforcement and institutional coordination.
The risk of corruption is moderate, with difficulties related to accountability and public procurement. These risks are particularly relevant in the context of licensing and exploration activities.
Liberia’s main challenge is to attract investment in a competitive global environment, while ensuring that governance systems are robust enough to manage future resource development.
- Guinea and Guinea-Bissau
Guinea and Guinea-Bissau have limited but promising hydrocarbon potential, mainly in offshore basins. Exploration has been sporadic and no significant production has been established.
Both countries face significant political and governance challenges. Guinea has experienced political instability, including coups, while Guinea-Bissau has struggled with chronic instability and weak institutions.
Governance frameworks for the oil sector are underdeveloped and institutional capacity is limited. The risk of corruption is high, reflecting broader governance weaknesses (Transparency International, 2024).
The development of the oil sector in these countries will depend heavily on improved political stability and governance.
The Gambia
The Gambia has been conducting offshore exploration activities and has identified potential hydrocarbon resources, but the sector remains at a preliminary stage of development.
Politically, the country has undergone a transition to democratic governance in recent years, which has improved stability and investor confidence. However, its institutional capacity remains limited.
Governance frameworks are being developed, with the support of international partners. The risk of corruption is moderate, and efforts are being made to improve transparency and accountability.
The main challenge for The Gambia is to strengthen its institutional capacity to effectively manage the potential development of its resources.
6.8- Regional synthesis
In West Africa, the oil sector has a wide disparity in terms of political stability, quality of governance and corruption risks. Established producing countries, such as Nigeria and Angola (Central Africa), face significant legacy challenges, while emerging countries, such as Senegal and Mauritania, Côte d’Ivoire, Ghana, and even Benin, have the opportunity to put in place stronger governance frameworks from the outset.
A common trend emerges across the region: countries with stronger political stability and governance structures are better positioned to attract investment, manage their resources effectively, and achieve sustainable development goals. Conversely, weak governance and high levels of corruption continue to undermine sector performance and economic spillovers.
General Conclusion
The exploration and exploitation of oil and gas resources in West Africa requires good public governance, i.e. that of the State as the Authority, owner of the resources, and good governance of public and private companies as an operational contractor. This governance provides a framework for all the measures, rules, decision-making, information, implementation and evaluation bodies that ensure the best functioning and the most adequate control of the execution of the activities of the hydrocarbon sector by the various actors. In other words, good risk management in the sector.
In addition to good governance, which implies the establishment of the legislative and institutional framework and transparency in the management of oil resources and rents, it is crucial today for West African States to meet the challenges of skills training and regional cooperation in industrialization in order to gradually take control of the management of their resources through the development of the entire hydrocarbon value chain with a view to satisfying local, sub-regional and continental consumption needs within the framework of the AfCFTA, an ambitious historic project of African integration.
Thus, political stability, the quality of governance and corruption are key factors for success in the oil sector. Their influence extends to all levels of the value chain, shaping investment decisions, operational performance and economic outcomes.
Countries that are able to create a stable political environment, implement strong governance frameworks, and effectively fight corruption are better placed to take full advantage of their oil resources. Conversely, failing to address these challenges can lead to lost opportunities, lower investment and socio-economic instability.
For policymakers, the priority must be to strengthen institutions, increase transparency and ensure accountability. For operators and investors, robust risk management and compliance strategies are essential. As the global energy landscape evolves, the importance of these factors will only grow.
The negotiation of oil contracts, the monitoring, control and inspection of oil operations (cardinal elements of the mastery of oil contracts that require skills) and a more ambitious participation of States in oil contracts at the level of countries in the West African sub-region with proven and proven potential, will make it possible to limit, or even eradicate, the predation of hydrocarbon resources by the CPIs.
The export of hydrocarbons produced from the West African or African subsoil in its raw form constitutes an immeasurable loss for the States of sub-Saharan Africa in the field of industrial and technological development, employment and skills training.
All in all, after more than half a century of exploitation of oil resources, West African states are still far from taking control of the oil industry. Most of the income derived from resources through poorly followed and poorly controlled contracts is not used by the population but continues to feed hotbeds of tension in marginalized communities, most of which do not have access to the minimum subsistence level (health, education, energy, housing). Some provisions of the contracts signed for the exploitation of resources are used to mortgage our oil resources for the benefit of international oil companies acting on behalf of the major foreign powers. “Africa in general remains a thirsty fish in the ocean.”
In view of all the above, the five (05) fundamental and indispensable levers on which West African States or African States in general must act for the development of an oil industry for the benefit of their population are:
-
the adoption and operationalization of an integrative regional policy and strategy for the development of all links in the oil industry, from upstream to downstream oil. This policy should take into account the precautionary measures to be taken in the short or medium term on the export by the States of the sub-region of crude oil, for which they have no control over the mechanism for setting the price of a barrel, and recommend the export as a priority of finished products or products with higher added value through the development of the entire hydrocarbon value and processing chain.
-
The appropriation of technology through the training of competent national executives in specialized fields throughout the oil and gas chain in order to have the capacities required to take charge of the management of oil operations from upstream to downstream
-
The creation of an African Development Bank in the extractive industries sector that will make it possible to finance national and especially regional projects in the hydrocarbon sector
-
the creation of a regional oil market. The sine qanun conditions for the operationalization of this market are based on the establishment of industrial infrastructures for the transformation of crude hydrocarbons into finished products, oil and gas storage and transport infrastructures in order to facilitate trade in the sector between African sub-regions and then between African countries. As such, it is urgent to set up cartel hubs of specialized companies in different regions of Africa for the production and processing of hydrocarbons, i.e. the development of the entire value chain of the hydrocarbon sector in order to put on the market crude oil derivatives and by-products with higher added value.
-
Good governance in the sector that drastically reduces corruption and the confiscation of income by a ruling minority creating endogenous or externally generated conflicts. In this regard, States must set up institutions with clear and separate roles to ensure transparency and good management of resources throughout the sector’s value chain.
Glossary
Accumulation: The concentration of hydrocarbons in a trap or in a geological unit bounded by stratigraphic or structural rock boundaries.
ABEX: (Abandonment Expenditures): These are the expenses related to abandonment work
AFREC (African Energy Commission): A specialized agency of the African Union (AU), under the Department of Infrastructure and Energy, and responsible for the coordination, harmonization, protection, conservation, development, rational exploitation, marketing and integration of energy resources on the African continent
APPO (Organization of African Petroleum Producers): An African institution whose mission is to promote hydrocarbon cooperation among its member countries and other global institutions in order to foster fruitful collaboration and partnerships while using oil as a catalyst for energy security, sustainable development and economic diversification in Africa.
AVO (Amplitude Variation with Offset): Variation in the amplitude of seismic reflection as a function of the distance between the firing point and the receiver that indicates differences in lithology and fluid content in the rocks above and below the reflector. AVO analysis is a technique that allows geophysicists to determine the thickness, porosity, density, velocity, lithology, and fluid content of rocks.
Sedimentary basin: A depression within which sediment is deposited. It is a segment of the Earth’s crust that has undergone downward deformation, usually for a considerable period of time, but with intermittent elevations (hosts) and subsidence (grabens). The thickness of the sediment in these basins increases towards the centre of the basin.
Barrel: A standard unit of measurement used in the petroleum industry to quantify the volume of crude oil or crude oil products. One barrel is equivalent to 42 U.S. gallons, or about 159 liters. It is therefore a volumetric measurement, which is different from units of weight such as the ton. The barrel is mainly used to measure the production and marketing of oil on international markets.
Bitumen: Heavy oil residues used for road surfaces and roof waterproofing
Block: Geographical area delimited by a State and intended to be the subject of rights to prospect, explore, or even exploit hydrocarbon resources
Bright Spot (or Dim Spot): A seismic amplitude anomaly characterized by bright spots (or weak spots) of amplitude resulting from variations in lithology and pore fluids, sometimes observed in groups of superimposed reservoirs. It is a high-amplitude reflection on a seismic profile caused by the acoustic impedance contrast between rock layers and can indicate the presence of hydrocarbons. Bright spots result from large variations in acoustic impedance that occur when a gaseous sand lies under a shale, but can also be caused by phenomena other than the presence of hydrocarbons, such as a change in lithology.
Brent: A type of crude oil used as a standard or benchmark in the pricing of crude oil from Europe, Africa and the Middle East
CAPEX (Capital Expenditures): These are the capital expenditures represented by the funds used by an oil company to carry out exploration and development work.
Catalyst: A substance that increases the rate of a chemical reaction; it participates in the reaction but is not part of the products or reactants and therefore does not appear in the balance equation of this reaction.
ECOWAS (Economic Community of West African States): An intergovernmental body for West Africa whose purpose is to promote cooperation and integration with a view to achieving an economic union for West Africa, with a view to raising the standard of living of its peoples, maintaining and increasing economic stability, strengthening relations among member states and contributing to the progress and development of the African continent.
Oil field: An oil zone of variable extent giving rise to the production of natural hydrocarbons, constituting a single geological, structural, stratigraphic entity. It can be assimilated to a single deposit or to several distinct deposits, either in the vertical or in the horizontal direction, or in both at the same time, in the same geological and structural whole.
Gas Chimneys: A leak of underground gas from a poorly sealed accumulation of hydrocarbons, visible in seismic data as areas of poor quality because it causes a low rate of propagation in the overlying rocks. It is also a DHI.
Oil shock: A sudden and significant increase in the price of crude oil on the international market, often caused by a geopolitical crisis, a war, a strategic decision by producing countries, or a natural event disrupting supply while demand remains very high.
Condensate: Heavy components of natural gas accumulations from natural liquefaction when natural gas arrives at the surface. Otherwise, condensate is a condensation product sometimes known as distillate.
Conversion: Physico-chemical refining processes that include:
-
cracking that makes it possible to break the large molecules of the heavy fractions resulting from distillation (separation) into smaller molecules with higher added value, or
-
catalytic reforming that converts naphtha into high-quality gasoline and also produces hydrogen or
-
hydroconversion , which consists of converting refining residues by the addition of hydrogen into more usable products
-
coking by removing carbon from residues to obtain coke for use as fuel
DHI (Direct Hydrocarbons Indicator = Direct Hydrocarbons Indicator): A type of seismic amplitude anomaly or event that can occur in a reservoir containing hydrocarbons. These amplitude anomalies include Bright Spot or Dim Spot, Flat Spot, Gas Chimneys, etc. typically seen during AVO scans.
\mathbf{Densité\ API =}\frac{\mathbf{141,5}}{\mathbf{Densité\ à\ 15{^\circ}C}}\mathbf{- 131,5}
API density: A scale adopted by the American Petroleum Institute (API) that evaluates whether oil is light or heavy in relation to water. It is calculated by the formula:
-
Light oil (API > 30°) Light oil is highly prized on the world market because of its low viscosity and its ability to produce high-value-added refined products such as gasoline, kerosene and diesel. For example, West Texas Intermediate (WTI), mined in the United States, is a light crude widely used as a global benchmark. Similarly, Brent Crude, from the North Sea oil fields, is another emblematic example.
-
Medium oil (API between 20° and 30°) This type of oil is between light and heavy. Although it is less fluid than light oil, it is still relatively easy to refine. Examples include some crudes produced in the Middle East, such as Arabian Medium.
-
Heavy oil (API between 10° and 20°) More viscous and dense, heavy oil requires complex processes to be refined. For example, Venezuelan heavy oil, from the Orinoco Basin, is known for its technical challenges related to its transport and processing.
-
Extra-heavy oil (API < 10°) This type of crude oil is almost solid at room temperature and often contains bitumen. The tar sands of Alberta, Canada, are a major source of extra-heavy oil.
Well logs: Records obtained by lowering instruments into wells and continuously recording some physical properties of rocks.
Distillation: see Separation
Well Testing: Well testing performed with the drill string still in the hole, commonly known as Drill Stem Testing (DST). These tests are generally carried out using a closed down-the-hole tool allowing the opening and closing of the well at the bottom of the hole thanks to a valve operated on the surface. One or more pressure gauges are usually mounted on the DST tool and are read and interpreted after the test is complete. The tool includes a surface-actuated packer that isolates the formation of the annular space between the drill string and the casing, thus forcing the produced fluids to penetrate only the drill string. Closing the bottom of the well minimizes backflow and simplifies analysis, especially for low-flow formations. The drill string is sometimes filled with an inert gas, usually nitrogen, for these tests. In formations with low permeability, or when production consists primarily of water and the formation pressure is too low to bring water to the surface, surface production may never be observed. In this case, the volume of fluids introduced into the drill string is calculated and an analysis can be performed without obtaining surface production. Operators may want to avoid surface production for safety or environmental reasons and only produce the amount contained in the drill string. To do this, the surface valve is closed when the bottom valve is opened. These tests are called closed chamber tests.
Drill string testing is typically performed on exploration wells and is often essential to determine if a well has discovered a commercial hydrocarbon reservoir. The formation is often untubed prior to these trials, and the contents of the tank are often unknown at this stage. Fluid sampling is therefore usually a major concern. The most common test sequence consists of a short flow period of about five to ten minutes, followed by a pressure build-up period of about one hour, to determine the initial pressure of the tank. This is followed by a flow period of 4 to 24 hours to establish a stable flow to the surface, if possible, and finally a final shut-off or pressure rise test, to determine the thickness of the permeability and the potential for flow.
Recovery factor: See Reclaimability: The rate or proportion of crude oil or natural gas that can be extracted from the reservoir at the time of production to the surface relative to the amount originally in place and trapped in the reservoir.
R-Factor: A ratio determined by the ratio of revenues to costs and which is used as a trigger for the sharing of oil profit (profits) and in some cases for the determination of royalty rates
Flat Spot: A seismic amplitude anomaly that characterizes the contact between formation fluids (gas-oil, water-oil or gas-water), which can also indicate the dip of the reservoir in some cases.
Dissolved associated gas: Gas in contact with crude oil, either as a free gas layer or in solution with oil. It is the natural gas present in a reservoir in solution with crude oil, including the “gas cap”, which covers and is in contact with the crude oil.)
“Pipeline grade” gas: Marketed natural gas delivered to pipelines, typically in the range of 900 to 1,200 BTUs per 1,000 cubic feet and its general composition is as follows: Methane (CH4): 72.3%, Ethane (C2H6): 14.4%, Carbon dioxide (CO2): 0.5%, Nitrogen (N2): 12.8%
Natural gas: Hydrocarbons in a gaseous state under normal atmospheric conditions, including wet gases, dry gases, and residual gases produced singly or in combination after crude oil extraction.
Non-Associated Gas: Free gas that is not in contact with the crude oil in the tank.
Dry Gas: Gas composed almost entirely of methane
Gas pipeline: Pipelines that collect gas from a gas field and carry it to a remote location for use.
Field: see Oil Field
Commercial Deposit: An economically profitable field that can be developed and produced in accordance with the rules accepted in the international oil industry.
Generation: See Maturation
GIIP (Gas Initially In Place): The total volume of gas initially in place in the tank under standard surface conditions. It is divided into free gas and associated gas (dissolved in oil).
LNG = Liquefied Natural Gas: Natural gas condensed in a liquid state mainly methane. Natural gas is liquefied to facilitate its transportation when a pipeline is not possible. Less easily liquefiable than LPG, LNG must be subjected to low temperature and high pressure, or to an extremely low temperature (cryogenic) and close to atmospheric pressure to liquefy.
LPG (Liquefied Petroleum Gas ): A mixture of heavier paraffinic gaseous hydrocarbons, mainly butane and propane. These gases, which are easily liquefiable at moderate pressure, can be transported in liquid form and transformed into a gas once the pressure is released. Thus, liquefied petroleum gas (LPG) is a source of thermal energy as a fuel for internal combustion engines and has many industrial and domestic applications. Its main sources are natural gas and refinery gas, from which LPGs are separated by fractionation.
Gravimetric (surveying): Measuring changes in the Earth’s gravitational field using an instrument called a gravimeter, to understand variations in underground density and geological structures. It is therefore a geophysical method used in mining and oil exploration, groundwater assessment, geological mapping, etc.
Jet A1: Standard Aviation Fuel or Kerosene
Lead: A trap that may contain an accumulation of oil, but has not been mapped with a reasonable degree of certainty or whose contour is not precisely delineated.
NGL (NGL=Natural Gas Liquid): Hydrocarbons liquefied on the surface in field facilities or gas processing plants. Natural gas liquids include propane, octane and natural gasoline.
Magnetometry: An exploration method in which an instrument called a magnetometer measures the strength of natural magnetic forces in the Earth’s subsurface on land or at sea to detect changes in magnetic forces, which may indicate the existence of underground formations suitable for oil trapping.
Maturation: The process of generating hydrocarbons from source rocks under the effect of heat
Maturity: The thermal level required by a source rock to generate the hydrocarbon components normally found in oil.
Migration: The process by which hydrocarbons move from source rocks to reservoirs through openings in the rock. Migration falls into three categories:
-
Primary migration: movement of organic matter within the source rock to its boundary, where oil and gas leave the parent rock;
-
Secondary migration: movement from the bedrock boundary to the reservoir/trap, through permeable rocks (load-bearing beds), faults or fractures. For migration to be effective, the permeable pathways must be adequate and the trap must be present at the time of oil and gas migration (time).
-
Tertiary migration: migration of oil and gas from one trap to another or loss.
Naphtha: A fraction of straight-run gasoline used as a feedstock in conversion refining processes and also in the petrochemical industry, having a boiling point lower than that of kerosene
Pipeline: Pipeline carrying oil (“oléo” comes from the Latin oleum, meaning “oil”) and which allows the massive transport of oil. In practice, it can be crude oil or liquid fuel such as gasoline, diesel etc.)
OPEX (Operating Expenditures): These are the operating expenses that are the operating costs incurred by an oil company during the production phase and necessary to maintain the day-to-day operations and activities related to oil production
NATO: The North Atlantic Treaty Organization (NATO), or Atlantic Alliance, is a diplomatic and politico-military institution founded in 1949 by the Washington Treaty for the mutual defense and security of its 32 member countries, mainly in Europe and North America. It has expanded over time to Eastern Europe and is no longer considered a North Atlantic association.
Permeability: The ability of a porous rock to leak or transmit fluids when pores are interconnected
Crude oil: Crude mineral oil, asphalt, ozokerite, oil shale and all other liquid hydrocarbons in their natural state or obtained from natural gas by condensation or extraction, including condensates and natural gas liquids
Petrochemicals: A science that deals with the use of basic chemical compounds derived from petroleum to make other synthetic compounds that may or may not exist in nature; in the latter case, these compounds are said to be artificial. These manufactures are, in general, based on appropriate chemical reactions in the presence or absence of a catalyst.
Trap: A barrier or obstacle to migration that allows oil and gas to accumulate in a reservoir. These obstacles are usually impermeable rocks (cover rocks) located above, below and/or lateral to the reservoir rock. A trap must be of adequate size and seal. The filling of the trap corresponds to the volume of trapped hydrocarbons. The traps are of three categories:
-
Structural traps that result from folding, faulting, or other rock deformations. The most common trap is an anticline or faulted anticline.
-
Stratigraphic traps that result from lithological (facies) modifications, sometimes called “porosity and permeability pinching”.
-
Mixed traps that have both structural and stratigraphic aspects are called “combined traps”.
Play: A geographically delimited area or domain where several geological factors (presence of bedrock, reservoir rock and cover rock) are present, making it possible to prove the existence of oil. Play is said to be confirmed when oil is found there; the discovery is not necessarily profitable. If no finds have yet been found in an area, it is said to be unconfirmed.
Petroleum products: derivatives of the distillation of crude oil by refining or any other chemical transformation process in a liquid, solid or gaseous state including, but not limited to, all products such as: automotive fuels (petrol, diesel) and aviation fuels (Jet A1), LPG (commercial butane), kerosene, fuel oil, bitumen, lubricants, etc.
Preservation: Protection of trapped hydrocarbons from leaching, overcooking or biodegradation.
-
Leaching is washing of hydrocarbons with water.
-
Overcooking is the over-ripening of less desirable products.
-
Biodegradation is the decomposition by microorganisms.
Exploratory well: A hole drilled for hydrocarbons in a geological structure. It may also be referred to as a Wildcat well but sometimes includes the Evaluation wells.
Appraisal well: A hole drilled to delineate a new discovery**.** Also known as an appraisal well, it is used to determine the extent, limits, reserves and probable returns of a newly discovered hydrocarbon deposit.
Production well: A hole drilled to exploit a deposit. It is also called a development well
Dry well: Unproductive well
Porosity: Percentage of small free spaces in the overall volume of a rock;
Prospect: A trap that may contain an accumulation of oil, and is mapped in three dimensions.
Oil-producing province: A collection of sedimentary basins or geological structures that have the conditions necessary for the formation and accumulation of oil
Refining: any separation, conversion process that results in the transformation of crude oil into petroleum products including their chemical processing, storage and delivery to the appropriate point;
Retrievability: The ability to bring underground oil and gas to the surface. The factors that must be adequate are the permeability of the reservoir, the low viscosity (resistance to flow) of the oil, and the motive force of the reservoir (the driving force required for the production of hydrocarbons).
Reserves: Initially recoverable resources that licensees have decided to develop and for which the authorities have approved a development and operating plan. Reserves express the commercial and profitable nature of a discovered hydrocarbon deposit
Resources: New sources and potentially available reserves of hydrocarbons, including discovered and undiscovered sources.
Contingent Resources (Contingent Resources): Oil discovered that is potentially recoverable but is currently unmarketable.
Source rock: Sedimentary rock (usually deep buried shale/clay or limestone) whose organic matter has been naturally transformed into oil and/or gas by heat over time and burial. This transformation is called generation or maturation.
Cover rock: Clay or other impermeable rock acting as a barrier to the passage of oil migrating into the subsoil that covers the reservoir rock to form a trap.
Overburden rock: Sedimentary rock that overcoats, compresses and consolidates the source rock and contributes to its thermal maturation thanks to higher temperatures at great depths. It is an essential part of the petroleum system
Reservoir rock: A rock unit containing or potentially containing oil or gas that can be recovered from its small open spaces called pores. The reservoir rock must have adequate thickness, porosity and permeability.
Separation: The first basic step in the refining process or refining process, which consists of distillation, i.e. heating crude oil in a steel tower (fractionation column) in order to separate it into different components according to their volatility.
Seismic (acquisition): An exploration method by which strong, low-frequency sound waves are generated on land or in water to detect underground rock structures that may contain hydrocarbons. It provides information on the nature and succession of the rocks crossed as well as their fluid content. Seismic acquisition can be done in 2D (2 dimensions) or 3D (3 dimensions). 2D seismic acquisition provides less precise information than 3D, particularly with regard to the mapping of a hydrocarbon trap. There is also 4D seismic.
STOOIP (Stock Tank Oil Originally In Place): Total volume of oil originally in place in a tank under standard surface conditions
Chemical treatment: A refining process that consists of the removal of impurities by hydrotreating for light fractions or by hydrodesulphurization for heavy fractions
Flaring: The practice of the petroleum industry in which excess natural gas, usually methane, is burned in a controlled manner and cannot be stored or upgraded on-site. This produces a visible flame that escapes from a tall chimney called a flare.
VSP (Vertical Seismic Profil): This is a method of seismic logging carried out inside a single borehole. Instead of using surface sources and receivers as in conventional seismic surveys, VSPs use a seismic source positioned at the surface while the receivers are deployed downhole inside the well. This vertical configuration allows for a more accurate and detailed image of the subsurface directly below the borehole.
VSPs are used in a variety of geological applications, including:
-
Reservoir Characterization: Evaluate reservoir properties and fluid distribution
-
Seismic Interpretation: Improving Seismic Imagery and Understanding Subsurface Structure
-
Fracture detection: Identify natural fractures in the reservoir
-
Borehole integrity: Assess the stability and integrity of the wellbore
-
Geotechnical Applications: Studying the Earth’s Structure for Engineering Projects
AfCFTA (African Continental Free Trade Area): an African Union project that aims to establish a continental market with the aim of boosting intra-African trade.
Bibliographical References
-
IEA (2023): Global Energy Investment Report
-
Alfred Kjemperud (2007): Petroleum contracts: fiscal régime – Taxation, The bridge Group AS
Anne-Charlotte ARMYNOT DU CHATELET, Alban LIEGEARD (2016):
Global oil and gas markets and security of supply, in Panorama
énergies-climat N°11 5p
-
World Bank (2023-2024): Global Governance Indicators
-
Bruce S. Hart (2000): 3-D Seismic Interpretation: A Primer for Geologists, McGill University, Montreal, Quebec; SEPM Short Course N°48 123p
-
Bruno Carton (2000): Oil in Africa, violence against peoples. Research Group for an Alternative Economic Strategy. 246 p
-
Claire Kupper & Margaux Vaghi (2014): Cartography of oil in West Africa, Groupe de Recherche et d’Information sur la Paix et la Sécurité (GRIP) 20 p.
-
UNCTAD (2023): World Investment Report
-
ECOWAS Commission (2019): ECOWAS Hydrocarbons Sector Development Policy (PDSHC)
-
Dankwa Kankam et Ishmael Ackah (2014): The Optimal Petroleum Fiscal Regime for Ghana: An Analysis of Available Alternatives, International Journal of Energy Economics and Policy Vol. 4, No. 3, 2014, pp.400-410
-
Dossou Rodrigue AKOHOU (2008): Offshore Oil Exploitation and International Law: Legal and Environmental Aspects for the Coastal States of the Gulf of Guinea, Division for Ocean Affairs and the Law of the Sea, Office of Legal Affairs, United Nations, New York
-
Energy Institute (2024): Statistical Review of World Energy 2024, 73ème edition, 72 p
-
IMF (2023): Budget Transparency and Country Reporting
-
Ezekiel Adesina, Ben Asante, Natalia Camba, Fisoye Delano, Richard Donohoe et al (2017): Understanding Natural Gas and LNG Options, U.S. Department of Energy, 248 p.
-
Farouk Al-Kasim (2007) Resource Management, Petroteam Stavanger
-
Gunnar Søiland (2000): Resource management aspects. Field Development, Concept selection, technical flexibility, Norwegian Petroleum Directorate
-
Gunnar V. Søiland (2020): Pre-license preparation Assessing the petroleum volume, Norwegian Petroleum Directorate
-
Gunnar V. Søiland (2021) Petroleum Value Chain and Decision Gate, Norwegian Petroleum Directorate
-
Ibrahima BA (2022): Data Collection Report and Diagnostic Analysis of Petroleum Legislation in ECOWAS Member States, Final Report; ECOWAS
-
Kojo Asante, Abdul-Gafaru Abdulai and Giles Mohan (2021): The ‘new’ institutional politics of Ghana’s hydrocarbon governance, ESID Working Paper No. 169 35 p
-
Kanga Konan (2015): Study for the development of a regional facilitation programme and the supply of petroleum products in the ECOWAS region - Final report, ECOWAS Commission, 120 p
-
Jean-Pierre Favennec, Philippe Copinschi (1999): The Upstream Oil in West Africa: State of Play, hal-02437351 21p
-
Jianjie Niu, Qi Liu, Jing Lv, Bo Peng (2020): Review on microbial enhanced oil recovery: Mechanisms, modeling and field trials, Journal of Petroleum Science and Engineering, 11 p.
-
Michael E. Brownfield and Ronald R. Charpentier (…): Geology and Total Petroleum Systems of the Gulf of Guinea Province of West Africa, U.S. Geological Survey Bulletin 2207-C, 39 p.
-
M. K. Appenteng, et Al (2013): Physicochemical characterization of the Jubilee crude oil, Elixir Appl. Chem. 54 (2013) 12513-12517
-
NNPC (2022): Annual Report
-
NRGI (2022): Resource Governance Index
-
OECD (2022): Report on Bribery of Foreign Public Officials
-
Pierre-Réné BAUQUIS, Emmanuelle BAUQUIS (2005): Understanding the Future of Oil and Natural Gas, 2nd edition
-
Petroleum Commission (2016): Overview: Ghana’s Oil and Gas Fiscal Regime
-
Pwc (2017): Tax Guide for Petroleum Operations in Ghana, November
-
REPUBLIC OF CÔTE D’IVOIRE (1993): Standard contract for sharing hydrocarbon production
-
REPUBLIC OF CÔTE D’IVOIRE (2012): Ordinance No. 2012-369 of 18 April 2012 amending Law No. 96-669 of 29 August 1996 on the Petroleum Code
-
REPUBLIC OF CÔTE D’IVOIRE (1996): Law No. 96-669 of 29 August 1996 on the Petroleum Code
-
REPUBLIC OF CÔTE D’IVOIRE (2019): Hydrocarbon Production Sharing Contract Block Cl-705
-
Republic of Ghana (2018): Petroleum (Exploration and Production) (General) Regulations, L.I. 2359
-
Republic of Ghana (2016): Petroleum Exploration and Production Act, Act 919
-
Republic of Ghana (2016): Petroleum (Exploration and Production) (Measurement) Regulations, L.I.2246
-
Republic of Ghana (2016), GNPC (2000) Model Petroleum Agreement of Ghana
-
Republic of Senegal (2012): Hydrocarbon Production Research and Sharing Contract, Cayar Offshore Profond
-
Republic of Senegal (2019): Law No. 2019‐03 of 1 February2019 on the Metropolitan Code
-
Republic of Senegal (2020): Decree No. 2020‐2061 of 27 October 2020 laying down the modalitiesfor the application of Law No. 2019‐03 of 1February 2019 on the Petroleum Code
-
Republic of Benin (2019): Law No. 2019-06 of 15 November 2019 on the Petroleum Code
-
Republic of Benin (2020): Decree No. 2020-501 of October 14, 2020 laying down the modalities for the application of Law No. 2019-06 of November 15, 2019 on the Petroleum Code
-
Republic of Niger (2017): Law No. 2017-63 of August 4, 2017 on the Petroleum Code
-
Republic of Niger (2018): Decree No. 2018-659 of September 25, 2018 laying down the modalities of application of Law No. 2017-63 of August 4, 2017 on the Petroleum Code
-
Sachs and Warner (1995): Natural Resource Abundance and Economic Growth
-
Suzanne AMELINA (2006) : Benin - The Half Glass of Oil
-
Tarek Ahmed (2010): Reservoir engineering handbook, 4th edition
-
Transparency International (2024): Corruption Perceptions Index
-
Wahab L and Diji CJ (2017): Comparative Analysis of Nigeria Petroleum Fiscal Systems Using Royalty and Tax Optimization Models to Drive Investments, Centre for Petroleum, Energy Economics and Law, University of Ibadan, Nigeria, 14 p.
TABLE OF CONTENTS
FOREWORD 9
[GENERAL INTRODUCTION 12](#general-introduction)
PART I: GENERAL INFORMATION ON THE OIL INDUSTRY AND THE CHALLENGES OF RESEARCH AND EXPLOITATION IN WEST AFRICA 15
1- VALUE CHAIN OF THE HYDROCARBON SECTOR 16
1.1- The segment Amont (upstream) 17
1.1.1-Features 17
[1.1.2- State of play in West Africa 18](#state-of-play-in-west-africa)
[1.1.3- Main challenges 22](#main-challenges)
1.2- The Midstream segment 22
1.2.1- Characteristics 22
[1.2.2- State of play in West Africa 24](#state-of-play-in-west-africa-1)
[1.2.3- Main challenges 24](#main-challenges-1)
1.3- The Downstream segment (downstream) 25
1.3.1- Characteristics 25
[1.3.2- State of play in West Africa 26](#state-of-play-in-west-africa-2)
[1.3.3- Main Challenges 27](#main-challenges-2)
1.4- Weaknesses in the West African oil industry value chain 27
[1.4.1- At the ECOWAS level 29](#at-the-ecowas-level)
[1.4.2- At the level of the APPO 29](#at-the-level-of-the-appo)
1.5- Possible solutions for an oil industry serving the region 30
[2- DIFFERENT PHASES OF UPSTREAM OIL AND THE ROLES OF STATES 32](#different-phases-of-upstream-oil-and-the-roles-of-states)
2.1- Pre-licensing phase 33
2.1.1- Definition of the concept 33
2.1.2- Strategy for awarding petroleum licences or authorizations 34
2.1.3- Financing of pre-licensing phase investments 36
2.1.4- Importance of the pre-licensing phase and responsibilities of the State 36
2.2- Exploration phase 37
2.2.1- Exploration methods and strategies 37
[2.2.2- Techniques for evaluating a prospect 40](#techniques-for-evaluating-a-prospect)
2.2.3- Financing of exploration activities 46
2.2.4- Responsibilities of States in the exploration phase 47
2.3- Development Phase 49
2.3.1- Definition and strategies 49
[2.3.2- Reservoir Evaluation Methodology 50](#reservoir-evaluation-methodology)
[2.3.3- Financing of development activities 52](#financing-of-development-activities)
[2.3.4- Roles and responsibilities of States in the development phase and Relevance of a PDO 52](#roles-and-responsibilities-of-states-in-the-development-phase-and-relevance-of-a-pdo)
2.4- Phase de Production 55
2.4.1- Definition and characteristics 55
[2.4.2- Recovery methods and strategies 57](#recovery-methods-and-strategies)
[2.4.3- Financing of production operations 58](#financing-of-production-operations)
[2.4.4- Responsibilities of the Host States in the production phase 58](#responsibilities-of-the-host-states-in-the-production-phase)
2.5- Abandon 61
2.5.1- Definition of the concept 61
[2.5.2- Financing of decommissioning/abandonment work 61](#financing-of-decommissioningabandonment-work)
[2.5.3- Responsibilities of States in the phase of abandonment 62](#responsibilities-of-states-in-the-phase-of-abandonment)
2.6- Summary of expenses and revenues during the life cycle of an oil project 62
[PART TWO: OIL CONTRACTS AND OIL TAXATION IN WEST AFRICA 64](#part-two-oil-contracts-and-oil-taxation-in-west-africa)
3- TAX REGIMES IN THE PETROLEUM SECTOR 65
[3.1- Tax system or system: Conceptual foundations 68](#tax-system-or-system-conceptual-foundations)
[3.2- The concession system 69](#the-concession-system)
3.3- The contractual system: 69
3.3.1- The Production Sharing Contract (PPC) 69
3.3.2- Service Contracts 71
3.4- Structure of Oil Tax Systems in West Africa 72
3.5- Contractual frameworks in West Africa 72
4- COMPARATIVE STUDY OF TAX REGIMES IN SELECTED WEST AFRICAN COUNTRIES: 74
[4.1- Design principles of the flow diagram associated with the oil contract 75](#design-principles-of-the-flow-diagram-associated-with-the-oil-contract)
4.1.1- Petroleum Code 75
4.1.2- Tax regime 75
4.2. Key tax elements applied in selected West African countries 76
[4.2.1- Redevance ad valorem (royalty) 76](#redevance-ad-valorem-royalty)
[4.2.2 - Recoverable Petroleum Costs 77](#recoverable-petroleum-costs)
[4.2.3- Oil Profit 79](#oil-profit)
[4.2.4- Profit/corporate tax 83](#profitcorporate-tax)
[4.2.5-State participation 83](#state-participation)
4.3- In-depth analysis of tax regimes by country 85
4.3.1- Nigeria 85
[4.3.2- Ghana 85](#ghana)
[4.3.3- Senegal 86](#senegal)
[4.3.4- Côte d’Ivoire 86](#côte-divoire)
[4.3.5 - Benin and Niger 86](#benin-and-niger)
[4.3.6- Other West African countries 86](#other-west-african-countries)
4.4- State/Contractor income associated with the tax system in selected West African countries 89
4.5- Analysis and interpretations 97
4.5-1. On the net income of States/contractors and attractiveness to foreign investment 97
4.5-2. On the overall State/Contracting Party cash flows 99
[4.6- Some suggestions for maximizing the oil revenues of the States 100](#some-suggestions-for-maximizing-the-oil-revenues-of-the-states)
[4.6.1 - Recoverable Petroleum Costs 100](#recoverable-petroleum-costs-1)
[4.6.2- State participation 101](#state-participation-1)
4.7- Partial conclusion 101
[PART THREE: POLITICAL STABILITY, GOVERNANCE AND CORRUPTION IN THE OIL SECTOR 103](#part-three-political-stability-governance-and-corruption-in-the-oil-sector)
[5- KEY SOCIO-POLITICAL DETERMINANTS OF OIL SECTOR PERFORMANCE 104](#key-socio-political-determinants-of-oil-sector-performance)
[5.1-Political stability and its impact on the oil sector 106](#political-stability-and-its-impact-on-the-oil-sector)
[5.2- Governance Structures in the Petroleum Sector 107](#governance-structures-in-the-petroleum-sector)
[5.3- Corruption in the oil sector 108](#corruption-in-the-oil-sector)
[5.4- Interrelationship between stability, governance and corruption 109](#interrelationship-between-stability-governance-and-corruption)
[5.5- Stakeholder Risk Mitigation Strategies 109](#stakeholder-risk-mitigation-strategies)
[5.5.1- Roles of operators 109](#roles-of-operators)
[5.5.2 - Responsibilities of States 110](#responsibilities-of-states)
[5.5.3- Roles of international institutions 110](#roles-of-international-institutions)
[5.6-Future trends and emerging risks 110](#future-trends-and-emerging-risks)
[6- WEST AFRICA: IN-DEPTH COUNTRY ANALYSIS 112](#west-africa-in-depth-country-analysis)
[6.1- Nigeria 113](#nigeria)
[6.2- Ghana 114](#ghana-1)
[6.3- Senegal 115](#senegal-1)
[6.4- Côte d’Ivoire 116](#côte-divoire-1)
[6.5- Benin 117](#benin)
[6.6- Niger 118](#niger)
[6.7- Other West African countries 118](#other-west-african-countries-1)
6.7.1- Mauritania 118
6.7.2- Sierra Leone 119
6.7.3- Libéria 119
6.7.4- Guinea and Guinea-Bissau 120
6.7.5- The Gambia 120
[6.8- Regional synthesis 121](#regional-synthesis)
[GENERAL CONCLUSION 122](#general-conclusion)
[GLOSSARY 125](#glossary)
[BIBLIOGRAPHICAL REFERENCES 136](#bibliographical-references)